

US Dollar, Euro, British Pound, Australian Dollar, Japanese Yen – Price Action Setups:
Recommended by Daniel Dubrovsky
Get Your Free USD Forecast
EUR/USD Daily Chart – Rising Wedge in Focus
The US Dollar has been gaining against the Euro in recent days. This follows EUR/USD testing the ceiling of a bearish Rising Wedge chart formation. Now, the pair is aiming toward the floor of the pattern. While the price trend may remain bullish within the wedge, a breakout below (1.0787 – 1.0713) would open the door to resuming the dominant downtrend from last year. Otherwise, pushing above the 38.2% Fibonacci extension at 1.0941 exposes the April 2022 high.
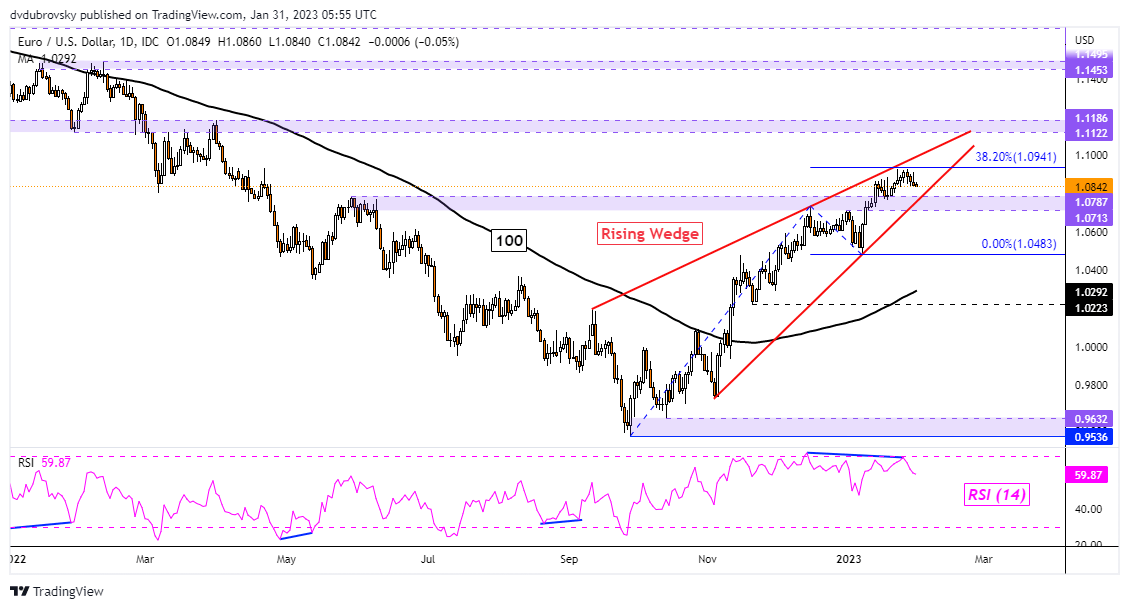
Chart Created in TradingView
GBP/USD Daily Chart – Double Top to Emerge?
The US Dollar is trying to hold its ground against the British Pound after Sterling bounced back to the December high. This makes for a zone of resistance between 1.2293 – 1.2444. A turn back lower towards 1.1951 could see a bearish Double Top emerge. Confirming a breakout under 1.1951 would open the door to extending losses toward the 100-day Simple Moving Average (SMA). Otherwise, breaking above exposes the May 2022 high at 1.2667.
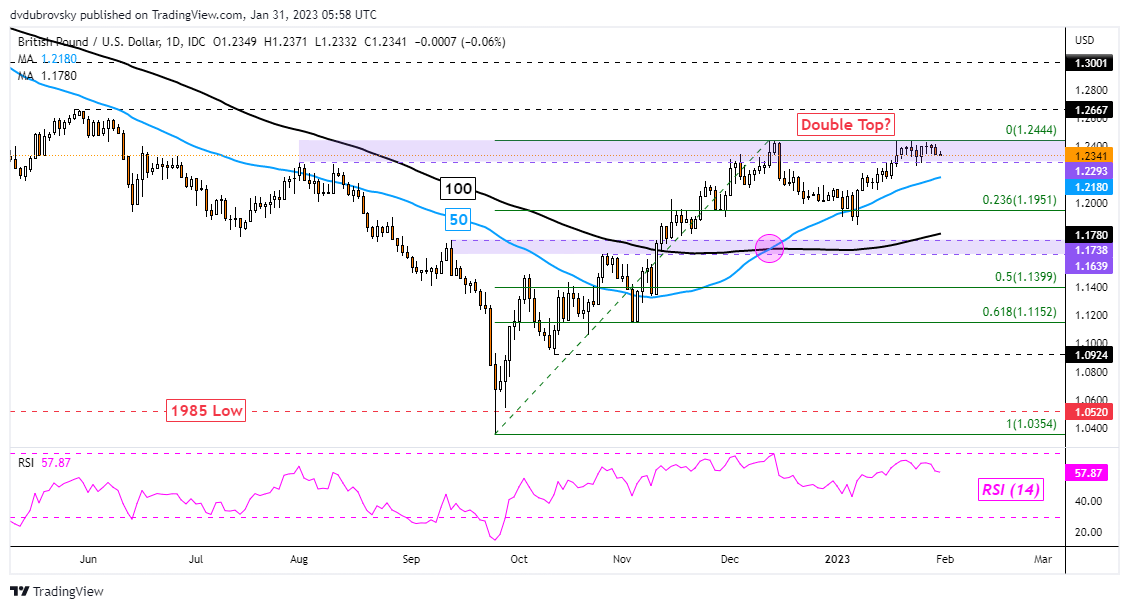
Chart Created in TradingView
AUD/USD Daily Chart – Turning Lower to Rising Wedge Support?
The US Dollar is also turning against the Australian Dollar. In recent days, AUD/USD rejected the August 2022 high at 0.7137, falling back toward the floor of a bearish Rising Wedge. Like EUR/USD, the near-term outlook remains bullish as prices consolidate higher within the wedge. However, breaking lower would open the door to a reversal, exposing the 100-day SMA. Meanwhile, pushing above 0.7137 opens the door to revisiting the June 2022 high at 0.7283.
Recommended by Daniel Dubrovsky
Get Your Free AUD Forecast
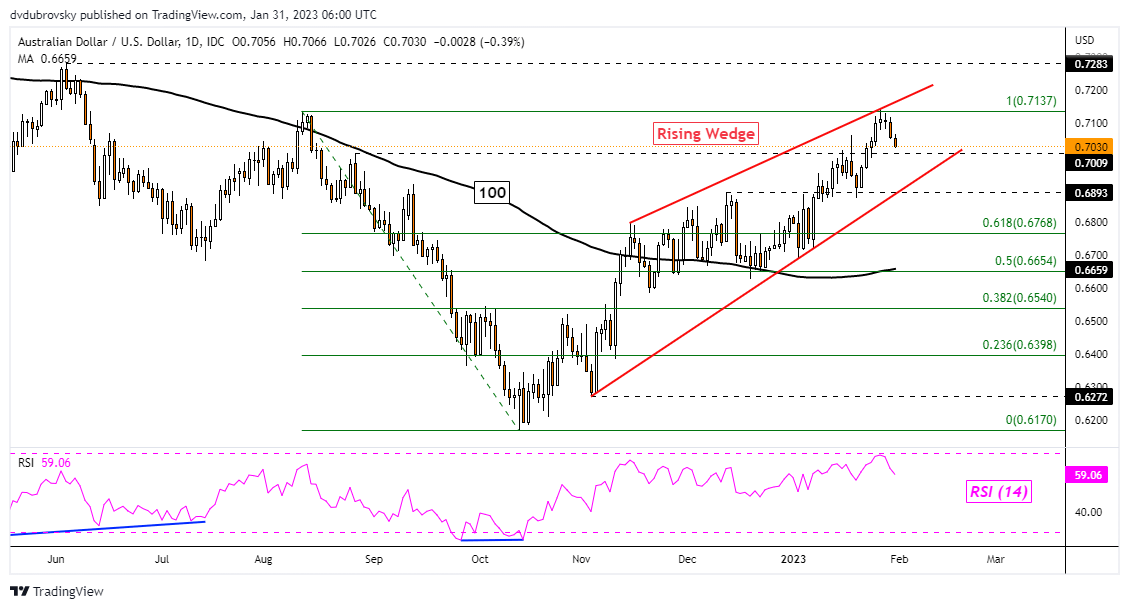
Chart Created in TradingView
USD/JPY Daily Chart – Falling Trendline in Focus
The US Dollar might be readying to reverse higher against the Japanese Yen. That is because USD/JPY broke above the key falling trendline from October. Granted, this push has been lackluster so far. Further gains could increasingly open the door to a reversal. In such an outcome, keep a close eye on the 50-day SMA. The latter could hold as resistance, maintaining the downside focus. Key support is the 100% Fibonacci extension level at 127.98. Falling under it exposes the May 2022 low at 126.362.
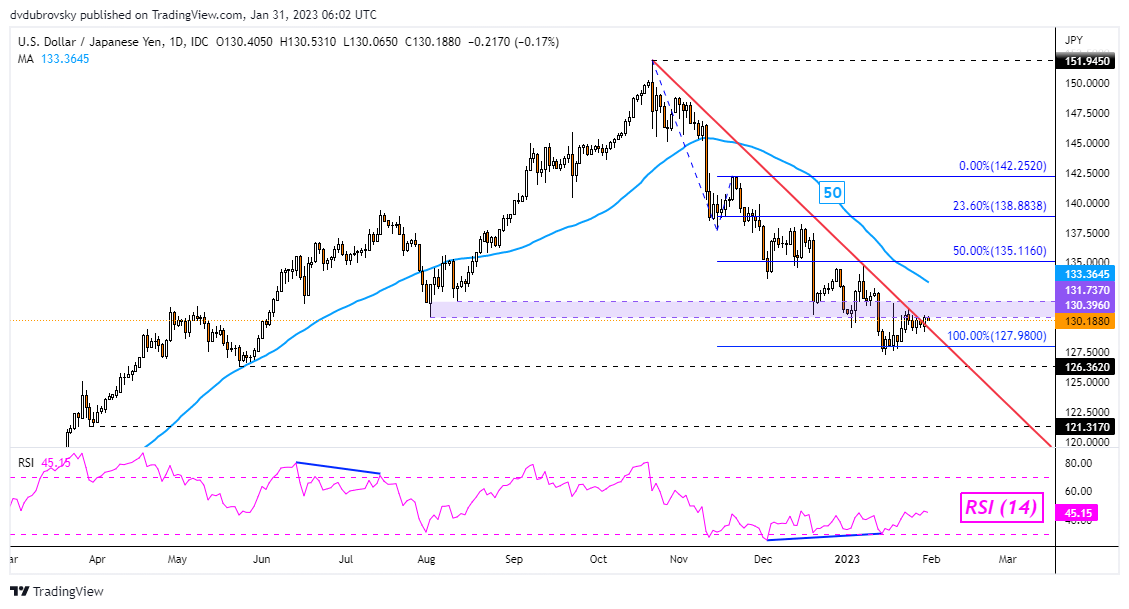
Chart Created in TradingView
— Written by Daniel Dubrovsky, Strategist for DailyFX.com
To contact Daniel, use the comments section below or@ddubrovskyFXon Twitter
Comments are closed.