XAU/USD, XAG/USD at Risk as Retail Traders Go Long
Gold, Silver, Retail Trader Positioning, Technical Analysis – IGCS Commodities Update
- Gold and silver prices have been weakening in recent weeks
- Retail traders responded by increasing their upside exposure
- Is this a sign XAU/USD and XAG/USD are in trouble ahead?
Recommended by Daniel Dubrovsky
Get Your Free Gold Forecast
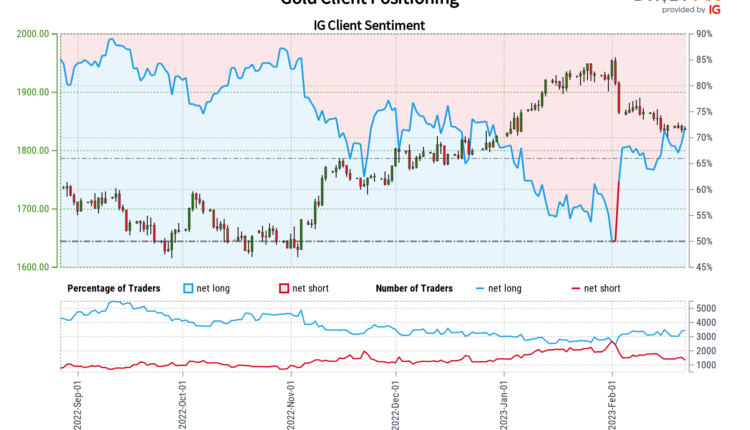
In recent weeks, gold and silver prices have been aiming lower as traders began pricing out once-anticipated rate cuts from the Federal Reserve towards the end of this year. That has pushed up the US Dollar alongside Treasury yields, denting precious metals. Retail traders have responded by increasing net-long exposure in XAU/USD and XAG/USD. This can be seen by looking at IG Client Sentiment (IGCS), which tends to function as a contrarian indicator. Is more pain ahead?
Gold Sentiment Outlook – Bearish
The IGCS gauge shows that about 72% of retail traders are net-long gold. Since most of them are biased to the upside, this suggests that prices may continue falling. Meanwhile, upside exposure has increased by 1.97% and 11.22% compared to yesterday and last week, respectively. With that in mind, the combination of current exposure and recent changes offers a stronger bearish contrarian trading bias.
XAU/USD Daily Chart
In the short-term, gold prices have been consolidating above the 38.2% Fibonacci retracement level at 1828. This followed a breakout under the 20- and 50-day Simple Moving Averages (SMAs), marking a reversal from the November – January uptrend. Now, a bearish Death Cross between the SMAs could be on the horizon – see chart. That may open the door to an increasingly downside technical bias. Breaking lower exposes the midpoint at 1787.
Recommended by Daniel Dubrovsky
How to Trade Gold

Chart Created in Trading View
Silver Sentiment Outlook – Bearish
The IGCS gauge shows that about 89% of retail traders are net-long silver. Since most of them are biased to the upside, this hints prices may continue falling. Meanwhile, downside exposure has decreased by 8.72% and 13.1% compared to yesterday and last week, respectively. With that in mind, the combination of overall and recent changes in positioning offers a stronger bearish contrarian trading bias.
Recommended by Daniel Dubrovsky
Improve your trading with IG Client Sentiment Data
XAG/USD Daily Chart
Silver prices appear to have found the next key level of support just above the midpoint of the Fibonacci retracement at 21.095 – see chart. A Hammer candlestick pattern was left behind recently, which is a sign of indecision relative to the near-term downtrend since late January. Still, a bearish Death Cross between the 20- and 50-day SMAs remains. The latter is offering a downside technical bias. Immediate resistance is the 38.2% level at 21.929. Clearing higher exposes, the 20-day SMA. Otherwise, extending losses places the focus on the 61.8% level at 20.261.

Chart Created in Trading View
— Written by Daniel Dubrovsky, Senior Strategist for DailyFX.com
To contact Daniel, follow him on Twitter:@ddubrovskyFX


Comments are closed.