Strong Performers FTSE and DAX Head Lower
European Indices: FTSE, DAX Analysis
Recommended by Richard Snow
Get Your Free Equities Forecast
DAX (Germany 40) Stalls at Recent High
The DAX appeared rather unperturbed after positive PMI data yesterday in the run up to the 1 year anniversary of the Russia-Ukraine conflict. A definite rise in geopolitical tensions across the globe has also weighed heavily on risk sentiment as China and the US point fingers at each other over the ‘balloon’ saga and Russia sends out a warning as Putin suspends important nuclear treaty. North Korea also plans to carry out intercontinental ballistic missile tests in response to planned US and South Korea military exercises.
In addition, global equities apart from maybe the SSE Composite in China, have followed US indices lower as better-then-expected US data continues to result in upward revisions to interest rate expectations which weighs further on equity valuations.
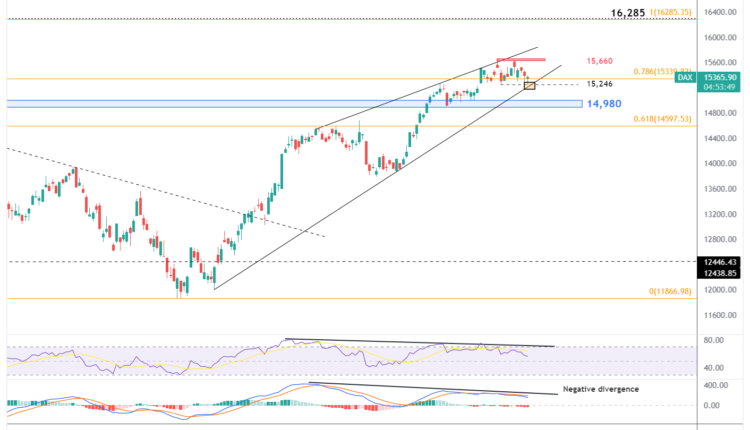
The DAX appears to have pulled back after retesting and failing to close above 15,660 as the index tests 15,246 – the recent low. The level coincides with trendline support. A gauge for a deeper pullback is the 14,980 zone of support (blue), followed by the 61.8% Fibonacci retracement of the 2022 major move. Bullish continuation can be assessed in the event price action breaks and closes above 15,660 with an eye on 16,285.
DAX Daily Chart
Source: TradingView, prepared by Richard Snow
The weekly chart helps identify the zone of support with a mid-point of 14,980. This was a key zone of support in 2022, holding up prices multiple times before giving way.
DAX Weekly Chart

Source: TradingView, prepared by Richard Snow
FTSE 100 on Track for First 2-Day Decline Since Mid-December
The FTSE 100 index continued 2023 in much the same way it ended 2022, powering to new heights. In fact, nearly every day last week provided a new all-time high for UK stocks. However, a sustained move higher and higher was always going to be a challenge, especially at a time when the Bank of England anticipates we’ll see consecutive quarters of negative GDP growth.
Positive UK PMI data, particularly in the services sector, lifted the pound and resulted in a rise in cable despite the dollar also receiving a lift on stronger US PMI figures too. The pound and the FTSE index has exhibited a negative correlation over time, meaning if gains for the local currency continue, the pullback in the index may extend further.
On the technical front, the FTSE, in much the same way as has been seen in the DAX, has made a number of higher highs while the RSI and MACD indicators revealed lower highs respectively. Such ‘negative divergence’ had been threatening of a move lower for some time now. Given that there has been such a strong bullish move, it is still too early to conclude a reversal, but levels to gauge the depth of a pullback remain clear.
Current price action tests the 7875 level as immediate support – this level coinciding with the prior January swing high. Thereafter, trendline support comes into play before the 7680 level. A break below 7680 warrants closer inspection as a continuation of the bullish trend would then come into question.
FTSE 100 Daily Chart
Source: TradingView, prepared by Richard Snow
Trade Smarter – Sign up for the DailyFX Newsletter
Receive timely and compelling market commentary from the DailyFX team
Subscribe to Newsletter
— Written by Richard Snow for DailyFX.com
Contact and follow Richard on Twitter: @RichardSnowFX


Comments are closed.