XAU/USD: The dollar is declining; along with it, indexes and gold prices are declining – Analytics & Forecasts – 22 June 2023

“Inflationary pressures continue to be high and there is a long way to go to bring inflation back to 2%,” Fed Chairman Jerome Powell told the House Financial Services Committee on Wednesday, and “my colleagues and I understand the difficulties that a high inflation, and we remain determined to bring inflation back to our 2% target”, while “it may make sense to raise rates more moderately”.
“We will continue to make decisions from meeting to meeting based on incoming data, their implications for the outlook and the balance of risk,” Powell added.
After his speech, the main US stock indices accelerated their decline, and their negative intra-week dynamics continued into the first half of the trading day on Thursday.
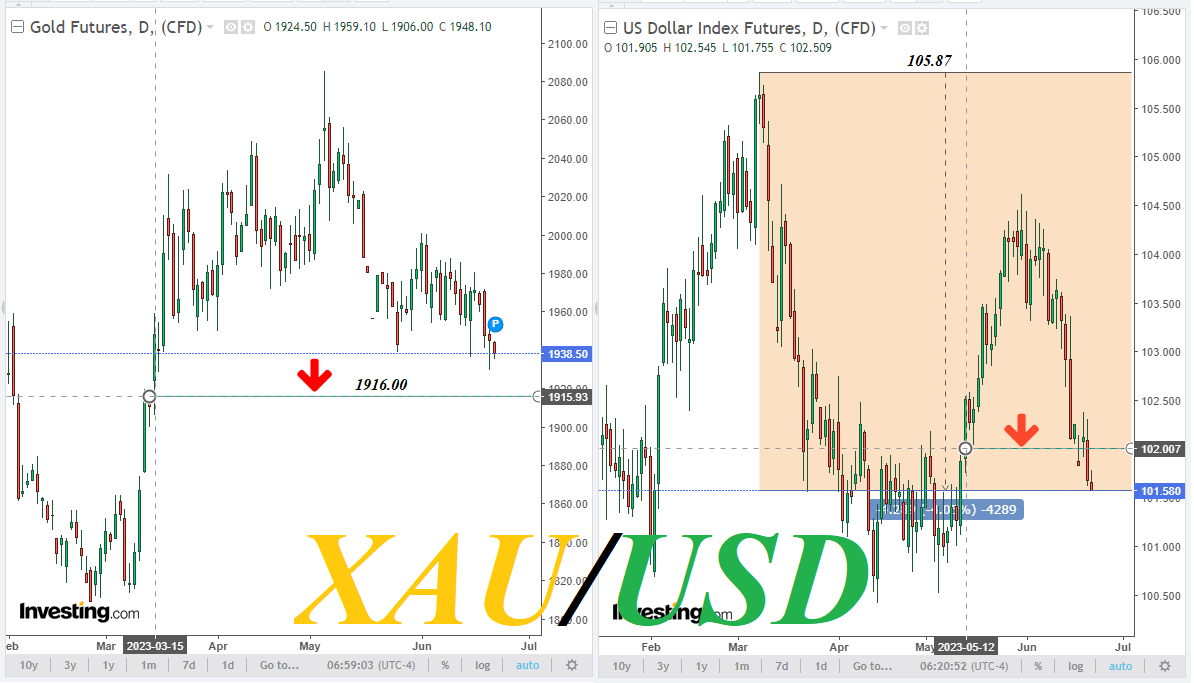
However, the dollar failed to capitalize on this as its DXY index broke through 102.00 yesterday and has already fallen to 101.60, the lowest level since May 12th. Another dissonance is observed on the market: the main US and world stock indices are falling, along with them the dollar and gold quotes are falling!!!, but the main commodity and European currencies are growing.
The dollar is likely to remain under pressure until positive and important macro statistics begin to come in from the US, and it is scheduled for Friday: at 13:45 (GMT) will be published preliminary indices (from S&P Global) of business activity (PMI) in manufacturing sector, component and service sector of the American economy. They are an important indicator of the state of these sectors and the American economy as a whole. The data above the value of 50 indicate an acceleration of activity, which has a positive effect on the quotes of the national currency.
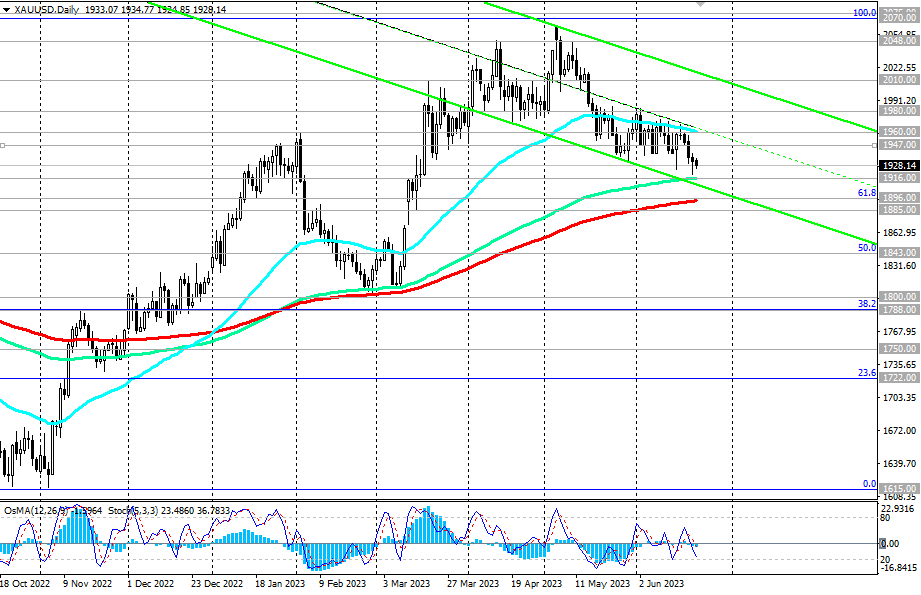
As for the gold mentioned above, its quotes are very sensitive to changes in the monetary policy of the world's largest central banks, primarily the Fed, and continue to decline today, while the XAU/USD pair is declining towards the lower border of the descending channel on the daily price chart, passing in the zone of key support levels 1916.00, 1896.00. A break of these levels and the support level 1885.00 will open the way for a deeper decline towards the key long-term support levels 1800.00, 1750.00, separating the long-term bullish trend of gold from the bearish one.
In an alternative scenario, the breakdown of the nearest and short-term resistance level 1936.00 will be the first fastest signal for the resumption of long purchases, and the breakdown of the resistance levels 1960.001980.00 will be a confirming one. Growth targets in this case are near the resistance levels 2000.00, 2048.00, 2070.00.
Support levels: 1916.00, 1900.00, 1896.00, 1885.00, 1843.00, 1800.00, 1788.00, 1750.00
Resistance levels: 1936.00, 1947.00, 1960.00, 1980.00, 2000.00, 2010.00, 2048.00, 2070.00


Comments are closed.