XAU/USD floats above $1,910 support, focus on China, US data – Confluence Detector
- Gold Price stays defensive above the key support confluence after snapping four-week downtrend.
- Cautious mood ahead of top-tier US employment, inflation clues prod XAU/USD buyers.
- China-inspired optimism, pullback in US Treasury bond yields, US Dollar put a floor under the Gold Price.
- US Core PCE Price Index, NFP will be the key after Fed policymakers highlight data dependency.
Gold Price (XAU/USD) remains dicey after pushing back the bearish bias with the first positive weekly close in five. The Yellow Metal’s latest inaction could be linked to the market’s anxiety ahead of this week’s top-tier US inflation and employment clues. In doing so, the XAU/USD fails to cheer the latest retreat in the US Treasury bond yields and the US Dollar, as well as China-linked optimism in Asia.
Apart from the pre-data caution, the Gold Price also bears the burden of the mixed statements from the US Federal Reserve (Fed) officials at the annual Jackson Hole Symposium. That said, major of the Fed officials defended restrictive monetary policies at last week’s key event but failed to suggest more rate hikes and also highlighted the data-dependency for future moves, which in turn suggests that Fed hawks are running out of steam.
Elsewhere, China announced one more measure to bolster economic activities but the mixed concerns about the US-China trade ties and fears of slower recovery in one of the world’s biggest Gold customers prod the XAU/USD bulls.
Moving on, this week’s China activity data and the Sino-American talks in Beijing will be crucial to watch for the Gold traders for clear directions. Also important will be the Federal Reserve’s (Fed) favorite inflation gauge, namely the Core Personal Consumption Expenditure (PCE) Price Index for July, and the monthly employment data for August.
Also read: Gold Price Forecast: XAU/USD set to range between two key moving averages ahead of US jobs data
Gold Price: Key levels to watch
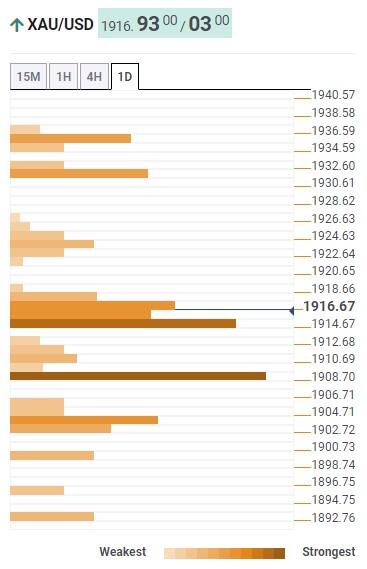
Our Technical Confluence indicator suggests that the Gold Price remains comfortably firmer above the $1,910 key support even as buyers hesitate of late. That said, the stated support confluence includes the 5-DMA, Fibonacci 23.6% on one-day and 38.2% on one-week, as well as the lower band of the Bollinger on the hours timeframe.
Ahead of that, the middle of the Bollinger on the four-hour play joins the Fibonacci 61.8% on one-day and 23.6% on one-week to restrict immediate XAU/USD downside near $1,915.
It’s worth noting that the previous monthly low and the bottom line of a Bollinger indicator on the four-hour chart, close to $1,903 at the latest, quickly followed by the $1,900 threshold, acts as the final defense of the Gold buyers.
Meanwhile, a convergence of the previous weekly high and Pivot Point one-day R1, close to $1,923-24, guards immediate recovery of the Gold Price.
Following that, the 50-DMA joins the Pivot Point one-day R2 and one-week R1 to highlight $1,933 as the key resistance for the XAU/USD bulls.
At last, the $1,935-36 zone comprising the 200-SMA on the four-hour and Fibonacci 61.8% on one-month could test the Gold buyers before giving them control.
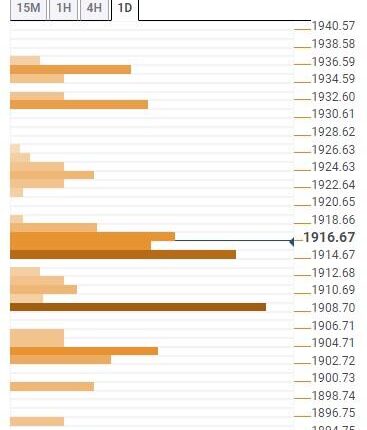
Here is how it looks on the tool

About Technical Confluences Detector
The TCD (Technical Confluences Detector) is a tool to locate and point out those price levels where there is a congestion of indicators, moving averages, Fibonacci levels, Pivot Points, etc. If you are a short-term trader, you will find entry points for counter-trend strategies and hunt a few points at a time. If you are a medium-to-long-term trader, this tool will allow you to know in advance the price levels where a medium-to-long-term trend may stop and rest, where to unwind positions, or where to increase your position size.


Comments are closed.