XAG/USD rally stalls amidst positive US data as bearish signals emerge
- XAG/USD risks a bearish-engulfing pattern and double-top formation as the price retreats from a 12-month high.
- A downward path is anticipated, with crucial support levels at $25.00 and $24.00 amid fading buying momentum.
Silver price retreats after reaching a 12-month new high at $26.13 in the New York session. An improvement in the US labor market due to an upbeat US jobs report trumped XAG’s chances to test last year’s high. At the time of writing, the XAG/USD is trading at $25.60, down 1.69%.
XAG/USD Price Action
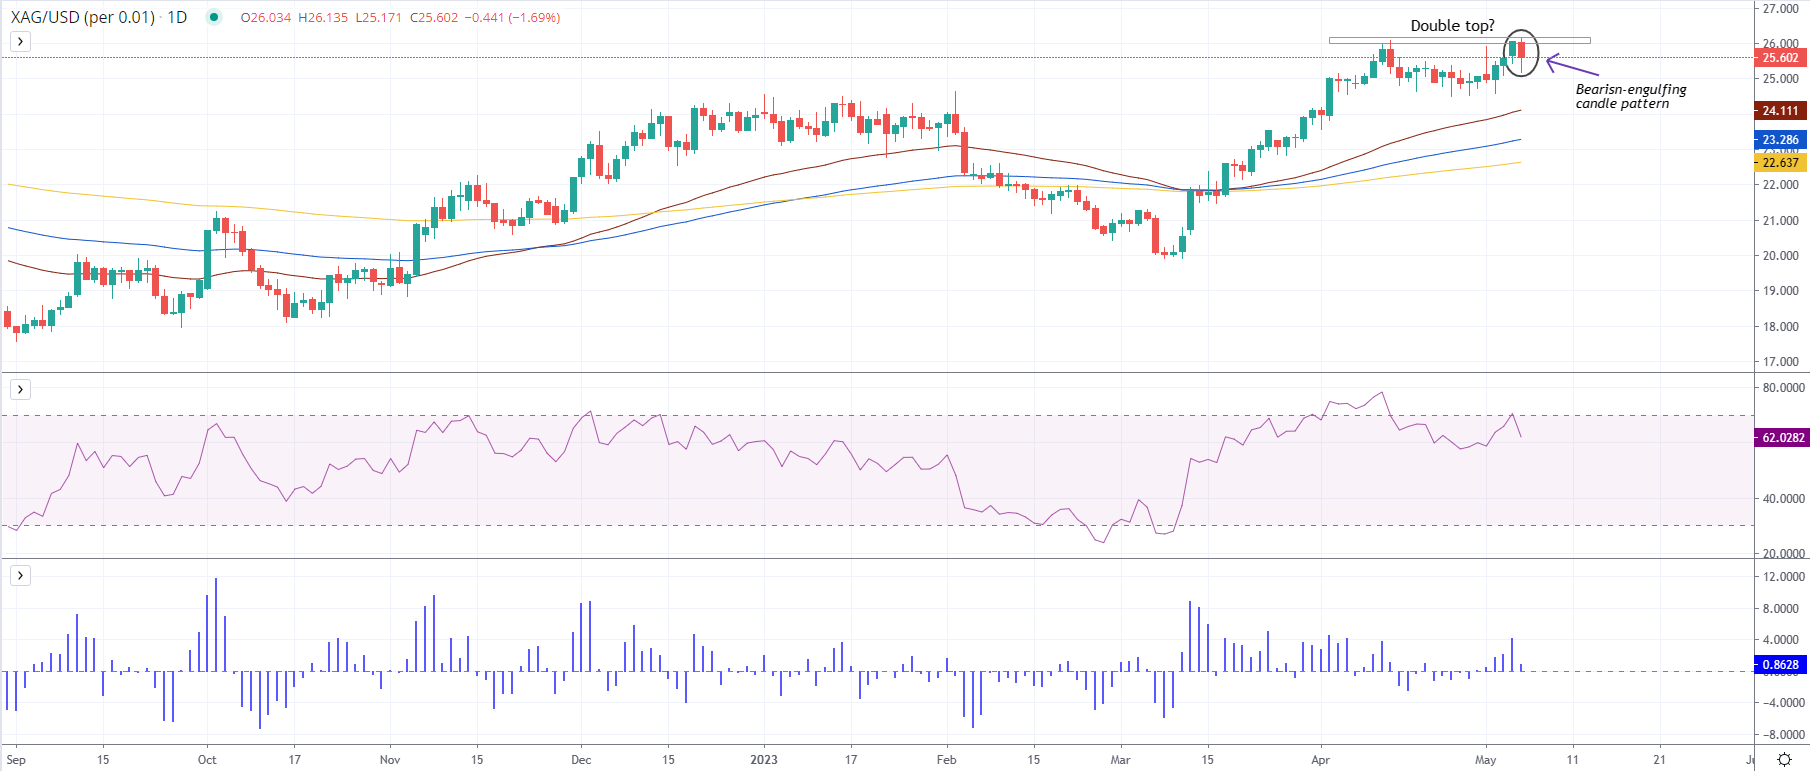
As of writing, XAG/USD is still upward biased but at the brisk of a pullback. If XAG/USD registers a daily close below the May 4 daily low of $25.44, that could form two bearish signals: firstly, a bearish-engulfing candle pattern which suggests that downward action is warranted. The second is the possible formation of a double-top, a major reversal chart pattern, which could drive prices toward the $24.00 figure.
The Relative Strength Index (RSI) indicator added another signal to the mix, forming a negative divergence. This means that as XAG/USD’s price action reached successive higher highs, the RSI peaked at lower highs as buying momentum faded. Additionally, the 3-day Rate of Change (RoC) shows that buying pressure is waning as sellers move into action.
Therefore, XAG/USD’s path of least resistance is downwards. The first support would be the $25.00 mark. A breach of the latter would expose the April 25 swing low of $24.49, followed by the 50-day Exponential Moving Average (EMA) at $24.11, which, once cleared and XAG/USD’s will challenge the $24.00 figure.
XAG/USD Daily Chart


Comments are closed.