USD/CAD at Fresh 2023 Highs After Bullish Breakout, Oil Forges Bearish Pattern
USD/CAD & OIL PRICES TECHNICAL OUTLOOK:
- USD/CAD appears biased to the upside in the near term
- Oil prices have been developing a bearish pattern in recent weeks, so the technical signals are negative
- Volatility could remain elevated as market sentiment sours amid soaring U.S. Treasury yields
Recommended by Diego Colman
Get Your Free USD Forecast
Most Read: US Dollar Outlook Turns More Bullish as Bond Yields Skyrocket Post PCE Data
Volatility reared its ugly head in the currency market this past week as U.S. Treasury yields soared across the curve on expectations that the Federal Reserve will have to keep its foot on the accelerator and continue to tighten monetary policy aggressively to tame persistently high inflationary pressures. This move boosted the U.S. dollar against most of its peers, while inflicting a deep wound on several commodities. In this article, we are only concerned with USD/CAD and oil, so let's take a look at the key charts to see what the technical analysis indicates for these two assets in the wake of recent events.
USD/CAD TECHNICAL ANALYSIS
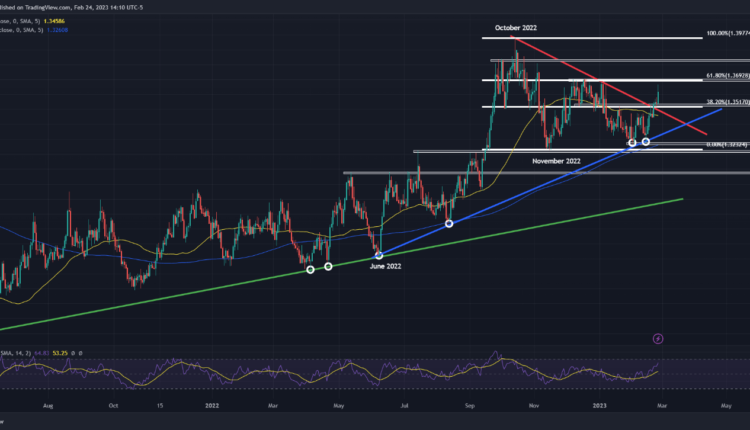
USD/CAD (US dollar – Canadian dollar) has been stuck in a consolidation phase for much of the month, but has finally broken out of its trading range this past week after decisively breaching a key descending trendline extended off the 2022 highs. This bullish breakout has taken the exchange rate to its highest level since the beginning of the year, luring new buyers into the market and creating the right conditions for further gains.
With price action biased to the upside, bulls could launch an attack on cluster resistance near 1.3700 in the coming days, a pivotal ceiling defined by the December 2022 highs and the 61.8% Fibonacci retracement of the October 2022/November 2022 pullback. If this barrier is taken out, USD/CAD could challenge 1.3825 in short order.
On the other hand, if sellers unexpectedly return and trigger a bearish reversal, initial support appears around the psychological 1.3500 level. Below that floor, an impeccable uptrend line extending from the June 2022 lows comes into play.
USD/CAD TECHNICAL CHART
USD/CAD Chart Prepared Using TradingView
Recommended by Diego Colman
Get Your Free Oil Forecast
OIL PRICES TECHNICAL ANALYSIS
Oil has been trending lower of late, with prices forging a bearish formation known as head and shoulders since late 2022 (S-H-S). The figure is almost complete, so a deep pullback cannot be ruled out if the technical configuration is validated. Confirmation could come with a drop below the pattern’s neckline near $73.50, in which case, a descent towards $70.25 appears likely. On further weakness, the focus shifts to $66.25, followed by $62.00.
On the flip side, if prices manage to rebound from current levels in a meaningful way, the first resistance to consider lies near the $78.00 mark, where the the 50-day simple moving average converges with a medium-term descending trendline. If this area is invalidated, buyers could target the $80.00 psychological handle and $82.75 thereafter.
OIL PRICES (WTI FUTURES) CHART

Crude Oil Futures (WTI) Chart Prepared Using TradingView
Written by Diego Colman, Contributing Strategist


Comments are closed.