S&P 500 on the new yearly highs
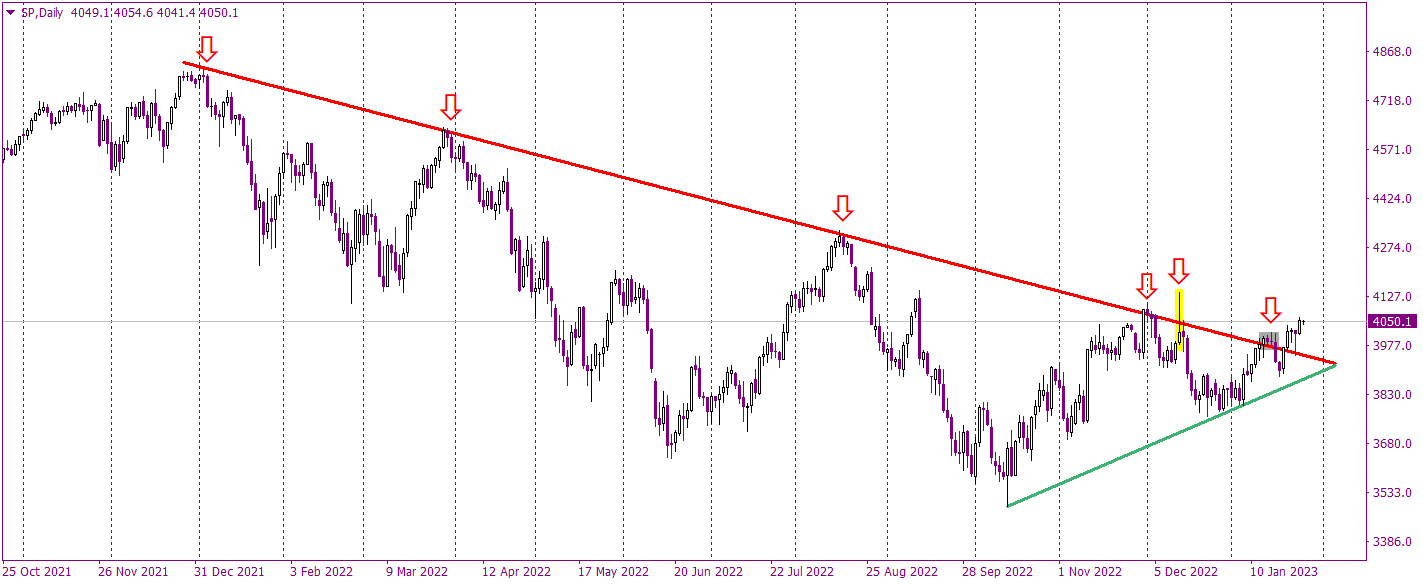
Last week, we were analyzing the S&P 500 and mentioned the most important line on the market – the long-term down trendline connecting the lower tops in the entire 2022. Traders worldwide were seeing this line and wondering if we will see a bounce and a following mid-term drop or a breakout and a following bull market.

We do not have to wonder about this anymore as on Monday, SP500 finally broke this down trendline establishing a mid-term buy signal. At first, traders were hesitating as other indices were not following this optimism. Two crucial sessions happened on Wednesday and Thursday. On Wednesday, SP500 tested the down trendline but this time from the top, and created a beautiful hammer candle, which showed a rejection of the lower levels. On Thursday, the price rose significantly, establishing new yearly highs, which is a confirmation of bullish momentum and the entire concept of the bullish breakout.
With all this, the sentiment is positive and the next few weeks should be bullish. A positive scenario will be canceled, when the price will come back below the red downtrend line but chances for that are now rather limited.


Comments are closed.