Natural Gas Prices Aim for Fifth Week of Losses, Doji in Focus Before Support
Natural Gas, Head & Shoulders, Doji – Technical Analysis:
- Natural gas prices heading for a fifth week of consecutive losses
- The bearish Head & Shoulders trajectory remains in focus next
- Doji candlestick emerged on daily chart as prices near support
Trade Smarter – Sign up for the DailyFX Newsletter
Receive timely and compelling market commentary from the DailyFX team
Subscribe to Newsletter
Weekly Chart – Head & Shoulders Breakout Remains in Focus
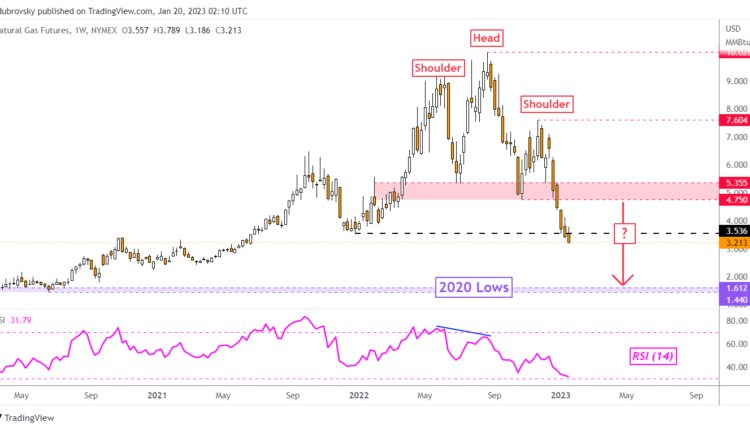
Natural gas futures are heading for a fifth consecutive week of losses with seemingly few technical signs of an impending reversal. That would be the longest losing streak since the middle of September. Looking at the weekly chart below, prices are attempting to confirm a breakout under the December 2021 low at 3.536, exposing the bottom achieved in 2020.
Prices have been trading in the anticipated downward trajectory of a bearish Head and Shoulders chart pattern, bringing natural gas closer towards the 1.44 – 1.61 support zone. The commodity broke under this pattern in late 2022, confirming a breakout earlier this month. That has opened the door to resuming what has been the dominant downtrend since the summer of 2022.
Chart Created Using TradingView
Daily Chart – Watch the Doji
Zooming in on the daily chart reveals that prices left behind a Doji candlestick pattern on Thursday. This is a sign of indecision within the context of trending markets. In this case, since the Doji appeared within the downtrend, it could be an early signal that momentum might be readying to reverse course. But, such confirmation is lacking.
Upside progress in the coming sessions could open the door to a reversal, placing the focus on the 20-day Simple Moving Average (SMA). The latter could hold as key resistance, reinstating the dominant downtrend. Still, even if prices turn meaningfully higher, the falling trendline from August is keeping the focus tilted lower. As such, there is plenty of room for consolidation before the downtrend fully ends.
The May 2021 inflection point at 3.15 seems to be immediate support. Closing under this price exposes the 100% Fibonacci extension level at 2.326 on the chart below. This would also overturn the Doji, opening the door to downtrend resumption. A look at RSI shows that divergence is lacking, hinting that momentum remains firmly pointed lower.
Recommended by Daniel Dubrovsky
The Fundamentals of Breakout Trading

Chart Created Using TradingView
— Written by Daniel Dubrovsky, Senior Strategist for DailyFX.com
To contact Daniel, follow him on Twitter:@ddubrovskyFX


Comments are closed.