Gold (XAU/USD) Prices at Risk of Freefall Heading Into NFP Day
GOLD (XAU/USD) KEY POINTS:
Recommended by Zain Vawda
Download the Full Q3 Forecast on Gold
READ MORE: Gold and Silver Price Forecast: XAU/USD, XAG/USD May Fall Amid Bullish Retail Traders
US Yields Rise, Red-Hot ADP Data, NFP Ahead
Gold prices continued their recovery in the Asian session following another day probing the key $1900/0z psychological level. Yesterdays red hot data out of the US facilitated the push toward the $1900 but failing to find acceptance below once more.
US ISM services and ADP data yesterday provided further signs of the resilience of the US economy despite growing calls that a recession is on its way. Following the release market participants understandably adopted a more hawkish outlook on the potential path of the Federal Reserve on the rate hike front. Money market pricing in the immediate aftermath were pricing in roughly 36bps of hikes by November, up from the 28bps ahead of the data releases.
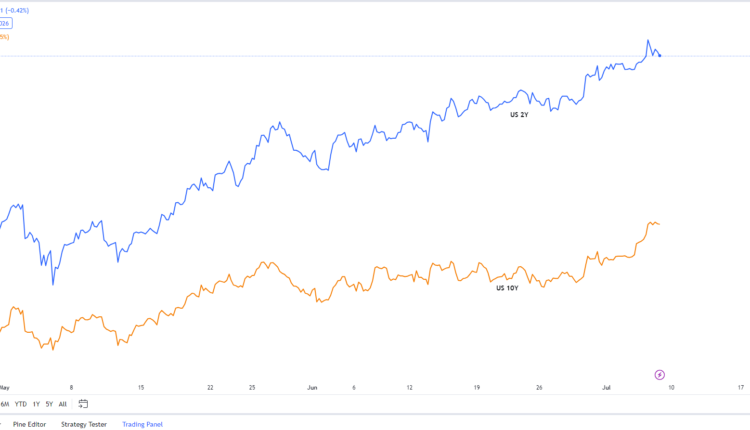
US Yields spiked higher in the aftermath of the data further weighing on gold prices as the US 2Y Yield briefly traded around the 5.12% mark, the highest since 2007. Despite this however the Dollar for some reason continues to struggle to hold onto gains with whipsaw price action seeming to be the case post data releases.
US 2Y and 10Y Yields
Source: TradingView, Prepared by Zain Vawda
Heading into today’s NFP and US jobs data, Gold bears will no doubt be hoping for another forecast beating print to finally inspire a sustained push below the $1900/oz handle. Another positive release for the US economy would undoubtedly see an increase in rate hike bets from market participants and facilitate another spike in both US Yields as well as the Dollar Index (DXY). This would in turn drag Gold prices lower and ensure a 4th successive week of losses for the precious metal.

For all market-moving economic releases and events, see the DailyFX Calendar
Recommended by Zain Vawda
Get Your Free Top Trading Opportunities Forecast
TECHNICAL OUTLOOK AND FINAL THOUGHTS
Form a technical perspective, Gold prices remain in a range between the $1890 and $1940 levels with the $1934 proving a tough nut for bulls to crack this week. Gold is currently trading in a bullish flag pattern if you will, which in theory preceded a bullish breakout. However, given the macro picture in play and the expectation of another positive NFP print, a downside breakout begins to look more appealing.
A daily candle close below the $1900 psychological level may finally see Gold make a long-awaited retest of the 200-day MA currently resting around the $1864 handle before a retest of the key $1850 support level comes into focus.
Gold (XAU/USD) Daily Chart – July 7, 2023
Source: TradingView, Chart Prepared by Zain Vawda
IG CLIENT SENTIMENT DATA
Taking a look at the IG client sentiment data and we can see that retail traders are currently net LONG on Gold with 74% of traders holding long positions (as of this writing). At DailyFX we typically take a contrarian view to crowd sentiment meaning we could see Gold prices continue to decline following a short upside rally.
Recommended by Zain Vawda
The Fundamentals of Range Trading
Written by: Zain Vawda, Markets Writer for DailyFX.com
Contact and follow Zain on Twitter: @zvawda


Comments are closed.