Gold Price Outlook Hinges on Key US Inflation Data, XAU/USD on Breakdown Watch
GOLD PRICE FORECAST
- Gold prices lack direction, languishing near the lowest level since August 29, as traders await new data
- The August U.S. inflation report, due for release next Wednesday, may be an important catalyst for precious metals
- This article looks at key XAU/USD’s technical levels that may come into play in the near term
Recommended by Diego Colman
Get Your Free Gold Forecast
Most Read: Canadian Dollar Outlook: USD/CAD on Cusp of Breakout Despite BoC’s Hawkish Hold
Gold prices (XAU/USD) struggled for direction on Thursday, moving between small gains and losses near the $1,920 level, in a session characterized by limited volatility in the precious metal space amid modest U.S. dollar strength and subdued Treasury yields ahead of a major risk event next week: the release of the latest U.S. inflation report.
In contrast to today’s choppy price action, September has seen gold relinquish some of the gains it had accrued in late August. This retracement can be attributed to the evolving macro landscape, which has kept bond rates on an upward trajectory and propelled the broader U.S. dollar to multi-month highs in a relatively short span of time.
At the core of the shift in market conditions is the reversal in U.S. data from weakness to undeniable strength. For example, business activity in the services sector, where most Americans work, surged in August to 54.5 from 52.7 in July according to ISM PMI figures, surprising to the upside by a wide margin and reaching its highest level since February.
Uncover strategies behind consistent trading. Download the “How to Trade Gold” guide for crucial insights and tips!
Recommended by Diego Colman
How to Trade Gold
While Fed officials have pledged to “proceed carefully” regarding future moves, the resilience of the U.S. economy may complicate the battle against inflation, potentially necessitating a more aggressive stance. In acknowledgment of this possibility, the odds of a quarter-point hike at the November FOMC meeting have shot up recently, rising from 28.6% to 45.2% over the course of four weeks.
If price pressures remain uncomfortably high, interest rate expectations will have room to drift upwards heading into the fall, creating a hostile environment for gold prices. In any case, traders will have more information to assess the outlook next week when the U.S. Bureau of Labor Statistics releases last month’s inflation figures.
In terms of estimates, headline CPI is forecast to have risen 3.8% y-o-y in August from 3.2% y-o-y previously. The core gauge, for its part, is seen easing to 4.5% y-o-y from 4.7% y-o-y previously, a positive but limited improvement for policymakers. On balance, the higher the actual CPI numbers, the worse for precious metals because of their implications for the Fed’s monetary policy roadmap and the U.S. dollar.
Gain a trading advantage by exploring market positioning. Download the sentiment guide to decode gold price behavior. It is totally free!
| Change in | Longs | Shorts | OI |
| Daily | -2% | 11% | 1% |
| Weekly | 6% | -18% | -2% |
GOLD PRICE TECHNICAL ANALYSIS
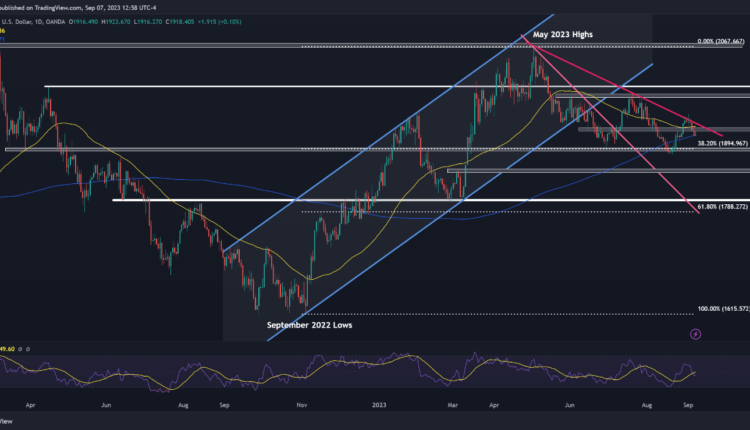
Gold showed strength in the latter part of August, but has since begun to trend lower over the past few days following a failed attempt at clearing short-term trendline resistance, as illustrated in the daily chart below.
After this pullback, XAU/USD currently hovers above its 200-day moving average. Although this technical indicator may provide support, a clean and clear breakdown could reinforce bearish impetus, setting the stage for a move toward $1,895, the 38.2% Fibonacci retracement of the September 2022/May 2023 rally. On further weakness, the focus shifts to $1,855.
On the flip side, if buyers regain control of the market and ignite a bullish rebound, initial resistance stretches from $1,930-$1,940. Successfully piloting above this barrier could rekindle buying interest, creating a conducive environment for a climb toward $1,985, followed by $2,000.
GOLD PRICE TECHNICAL CHART
Gold Price Chart Created Using TradingView


Comments are closed.