Crude Oil Market Looks Nervously To PMIs, Inventory Data
CRUDE OIL ANALYSIS & TALKING POINTS
- Price ranges are tightening before looming data
- The market remains dogged by a stronger Dollar and demand worries
- The US will release more crude from its reserve on Tuesday
Recommended by David Cottle
Get Your Free Oil Forecast
CRUDE OIL FUNDAMENTAL BACKDROP
Crude oil prices look a little stuck on Tuesday, perhaps as the market awaits key economic data due later in the week.
The market certainly remains weighed down by some fundamental pressure, with strong US inventory re-build revealed last week still dragging on it. More general worries about end-user demand are also palpable, as investors fret reduced economic activity in the face of the higher global interest rates put in place to fight inflation.
This week will see the release of important Purchasing Managers Index numbers from a range of major economies, including China and the United States, along with a new look at US energy inventory levels from the Energy Information Agency. Crude oil stockpiles are expected to be well below the shock 7.6 million barrel build seen last week.
Trade Smarter – Sign up for the DailyFX Newsletter
Receive timely and compelling market commentary from the DailyFX team
Subscribe to Newsletter
The US will sell an additional 26 million barrels of crude from its Strategic Petroleum Reserve (by some way the world’s biggest emergency supply) on Tuesday. President Joe Biden announced a series of sales from it last year to try an offset the rise in prices engendered by Russia’s invasion of Ukraine.
A stronger Dollar is also likely taking its toll on the market, which it tends to do given that the vast majority of internationally traded oil is bought and sold in the US currency.
Crude prices have weakened steadily since mid-February as stronger inflation data combined with more hawkish central bank commentary has blown away some of the more optimistic takes as to when interest rates might start to fall.
Crude Oil Technical Analysis
Introduction to Technical Analysis
Candlestick Patterns
Recommended by David Cottle
Chart Compiled Using TradingView
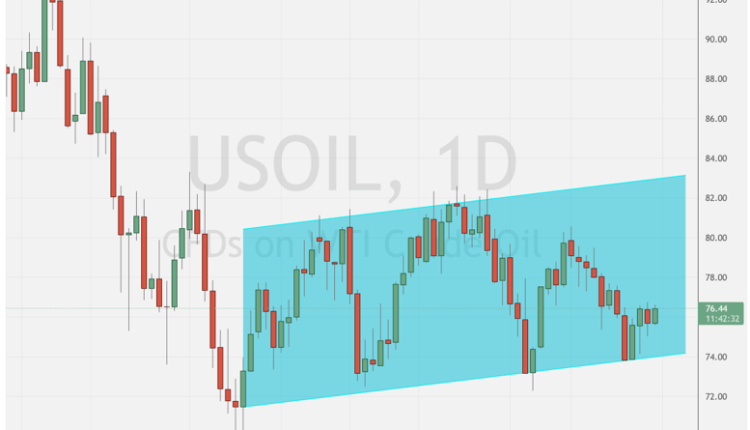
Crude’s technical chart is interesting right now, if a little inconclusive.
It’s perhaps surprising given recent fundamental weakness that the shallow uptrend from the lows of December 12 remains solidly in place having survived three clear bearish tests.
That said the chart clearly suggests that a ‘head and shoulders’ pattern is in place and, while that’s the case, momentum to the downside is likely.
A retest of that uptrend line doesn’t look very probable in the near term as it comes in some way below the current market at $74.02. Should it give way, however, the low of February 3 would provide support at $73.10, but there’s not much below that and those December depths, which were also one-year lows.
The bulls have a bit of a fight on their hands to prove that the market is not currently topping out at a new, ‘lower high’ in the $76.50 region, but the uncommitted may want to see how the market reacts to this week’s fundamental data events before taking a view. To really convince, the bulls are going to have to recapture and hold January 23’s peak at $82.52, and there’s little immediate sign that they have the will.
There’s certainly little support from the IG trading community, where fully 77% are bearish according to sentiment data. The bold may think this a little extreme, and a good reason to perhaps expect a little action the other way, but, again, this week’s economic news may need to play out first.
—By David Cottle for DailyFX


Comments are closed.