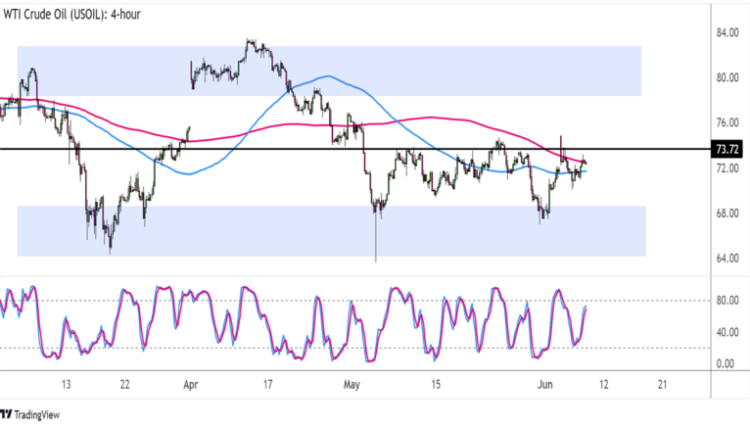
Chart Art: WTI Crude Oil (USOIL) Still Stuck in a Range
Here’s one for the commodity traders out there!
Check out these near-term inflection points on WTI crude oil.
The commodity has been moving sideways for quite some time, and it looks like it’s stuck inside an even smaller range this time.

WTI Crude Oil (USOIL) 4-hour Chart by TV
On the 4-hour chart above, you can see that crude oil has been pacing back and forth between support around $64-67 per barrel and resistance around $80 per barrel.
Price has recently bounced off the floor and is now up to the area of interest at the middle of the range.
Now this region has also been holding as resistance for quite some time, and it looks like the recent gap higher wasn’t enough to take the commodity price above the ceiling.
As the moving averages appear to be suggesting, crude oil might be setting its sights back down on the longer-term range bottom from here. After all, the 100 SMA is below the 200 SMA, and the latter is holding as dynamic resistance.
On the other hand, Stochastic has some room to climb before indicating exhaustion among buyers, so crude oil bulls might still be able to charge.
A break above the $74-75 per barrel zone could be enough to open the door for another move up to the large range’s top, so watch out!
Don’t forget that the OPEC+ recently announced voluntary output cuts, which means that global supply could remain limited amid potentially rising demand. Just make sure you keep tabs on risk sentiment when trading this risk asset, too.


Comments are closed.