Chart Art: Ether’s (ETH/USD) Range and AUD/CAD’s Potential Reversal
Looking for short or long-term trades today?
Either way, I got you covered with Ether (ETH/USD) testing a range resistance and AUD/CAD flirting with a downside breakout.
Which of these setups will you more likely trade?

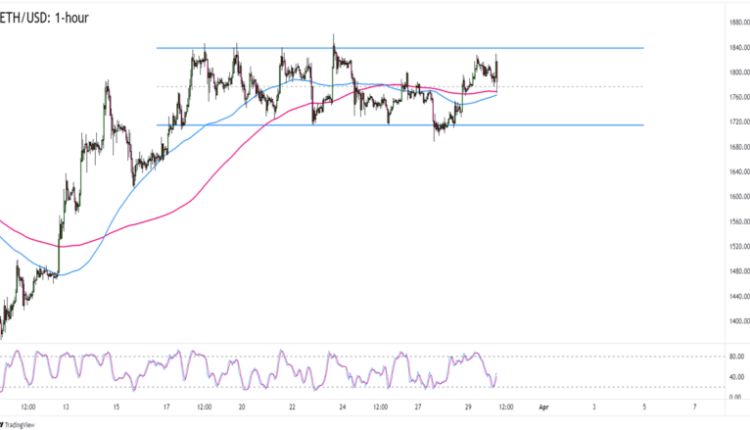
Ether (ETH/USD) 1-Hour Chart by TradingView
Ether has been ranging between $1,720 and $1,840 for almost two weeks now, and it looks like the ball is on the bears’ court!
That is, ETH/USD is almost at the top of the range and the most recent candlesticks are suggesting that the pair will soon retest the resistance zone.
Think ETH/USD will stick to its range? Bears who are betting on another rejection at the level can aim for the mid-range levels near $1,775.
If you think that we’ll see an upside breakout before the weekend, though, then you can take advantage of the current pullback and start scaling in until you do see a breakout.
Good luck and good trading this one!

AUD/CAD Daily Forex Chart by TradingView
If comdoll trading is more your thing, then you’ll want to know that AUD/CAD is sporting a possible Head and Shoulders pattern on the daily time frame.
Before you short the Aussie like there’s no tomorrow, however, you should also note that AUD/CAD’s “neckline” is uncomfortably close to the 200 SMA and a key resistance area from June and August.
In fact, with Stochastic nearing the “oversold” area, we could also see a bounce from AUD/CAD’s current levels.
Look out for bullish momentum that could bump AUD/CAD back to its .9150 or .9215 previous inflection points.
If AUD/CAD’s chart starts to look downside breakout-y, though, then you should also be ready to trade a breakout that could drag the pair to the .8975 or .8850 areas of interest.


Comments are closed.