Bulls eye a significant correction to the upside
- NZD/USD bulls in the market and eye a move to test resistances.
- The weekly M-formation is a compelling feature in this regard.
New Zealand Dollars rebounded from earlier dips on Monday, helped by China's data showing an accelerated recovery in the services sector. Additionally, the surprise hawkish decision from the Reserve Bank of Australia (RBA) has tugged the Bird along as well. At the time of writing, NZD/USD has rallied from the week´s peak low area finding support around the 0.6050s.
The following will illustrate the bias for an upside move on Wednesday:
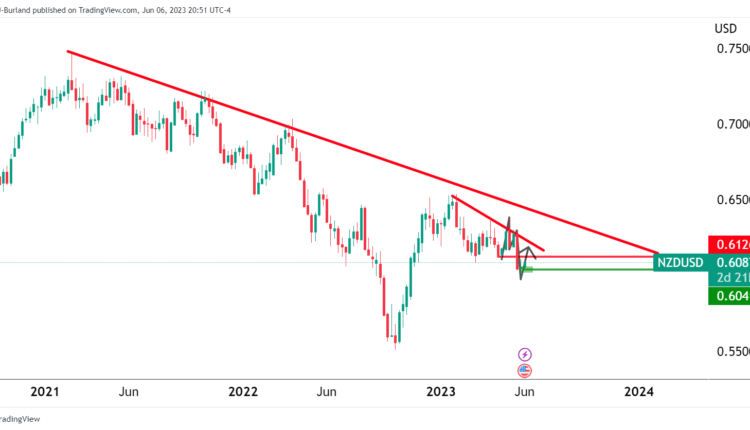
NZD/USD weekly chart
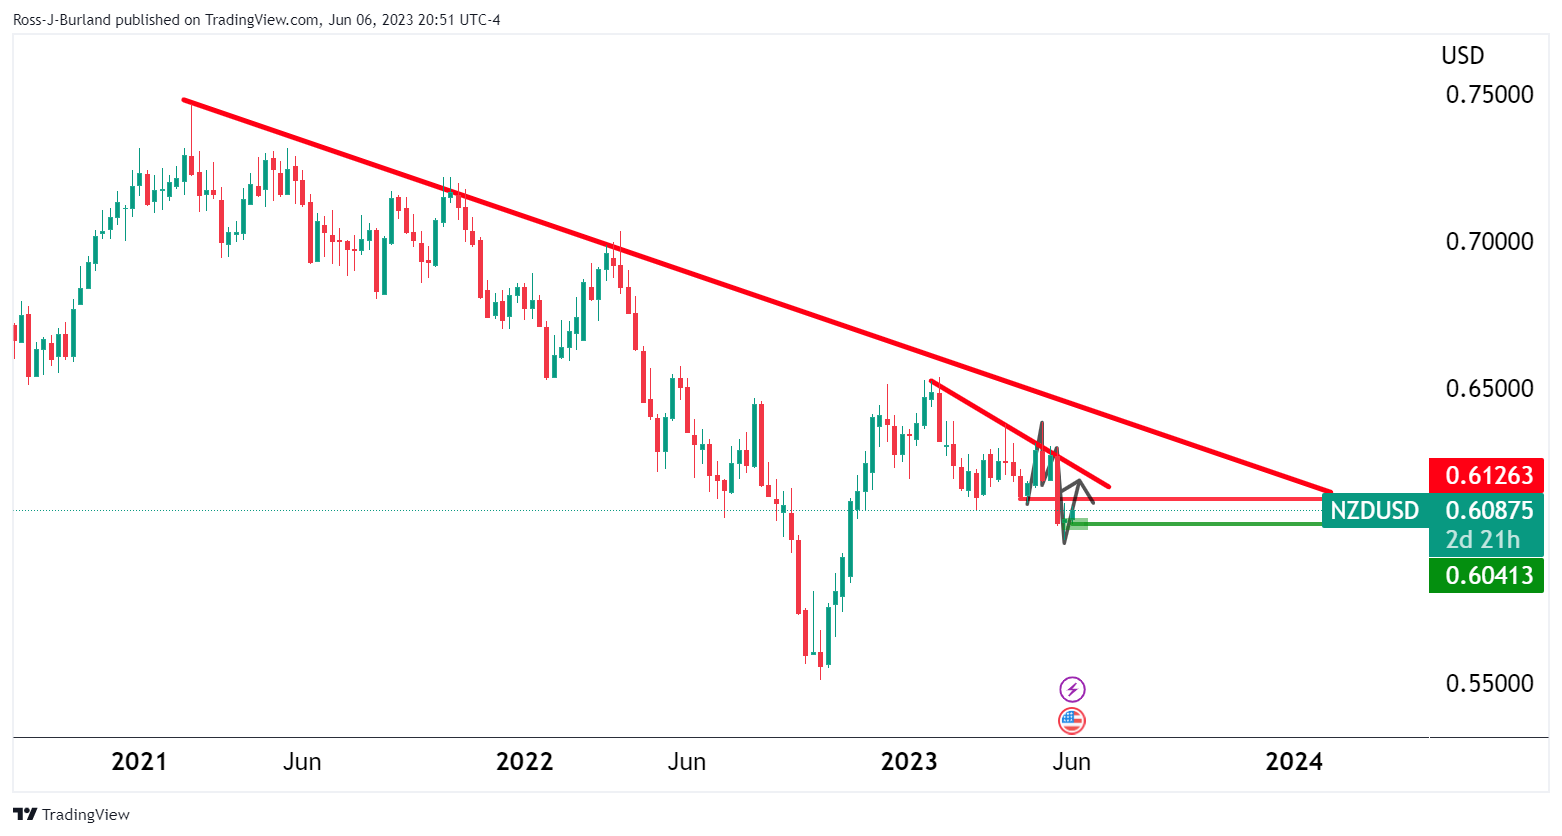
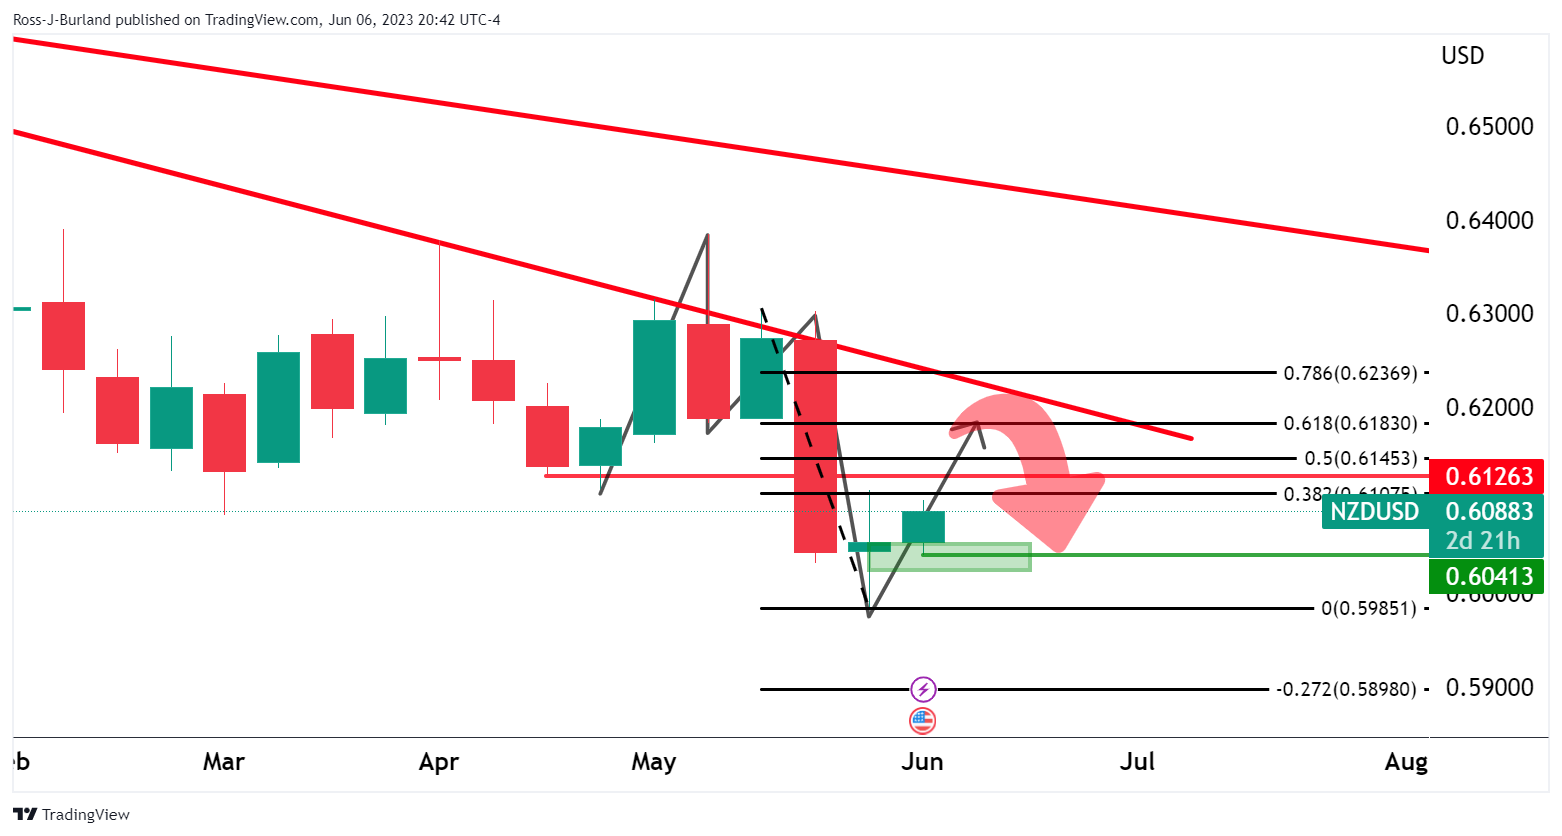
The weeklñy M-formation is compelling. This is a reversion pattern and the bulls are moving in for a target toward the neckline and a 61.8% Fibonacci. This meets the trenmdlñine resistance as well.
NZD/USD daily chart
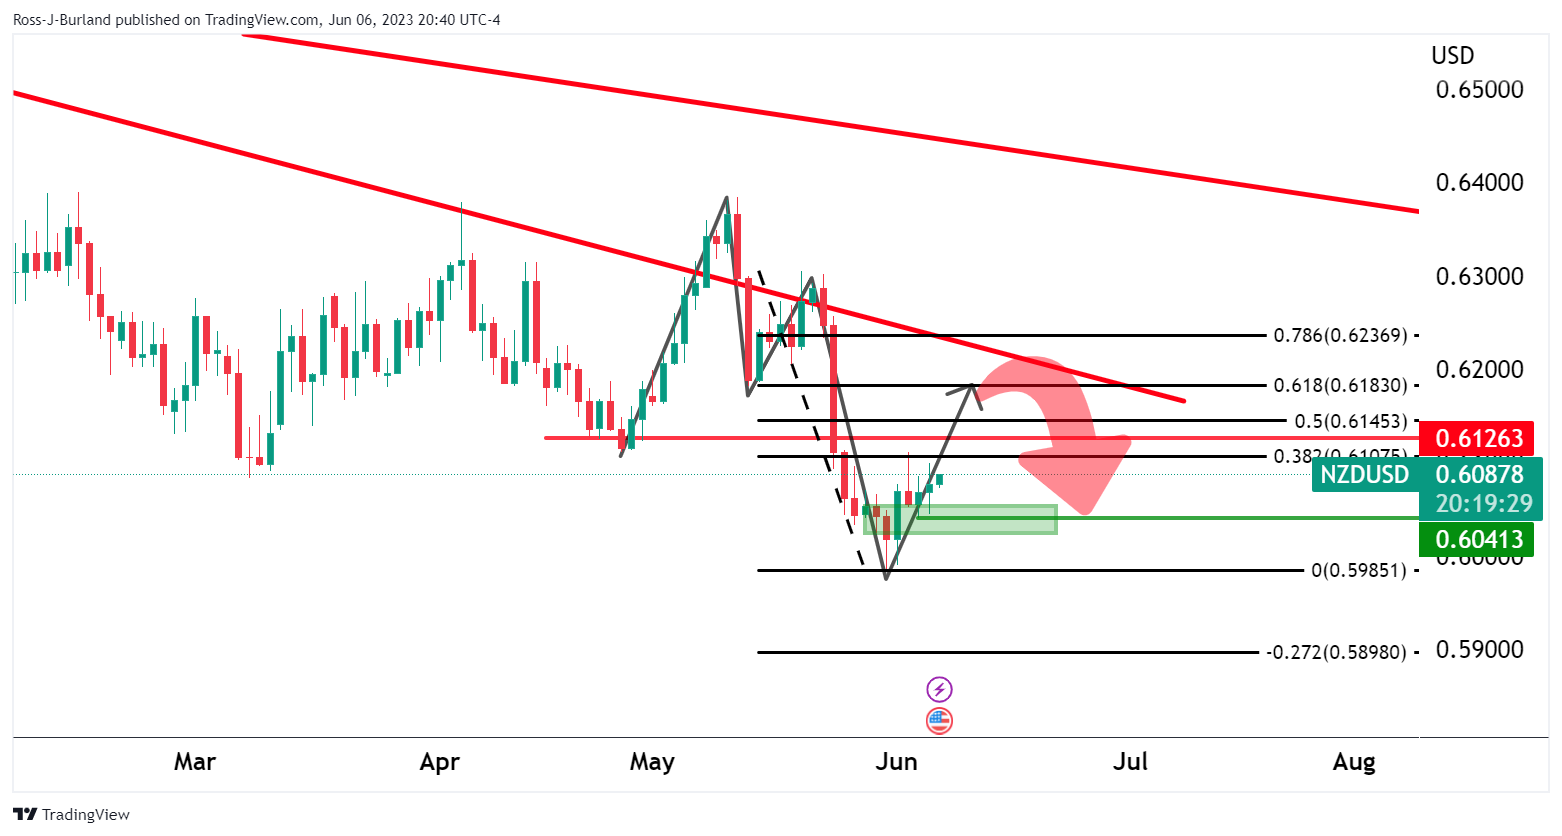
The daily chart aligns with the bullish bias as for the support area that is holding so far:
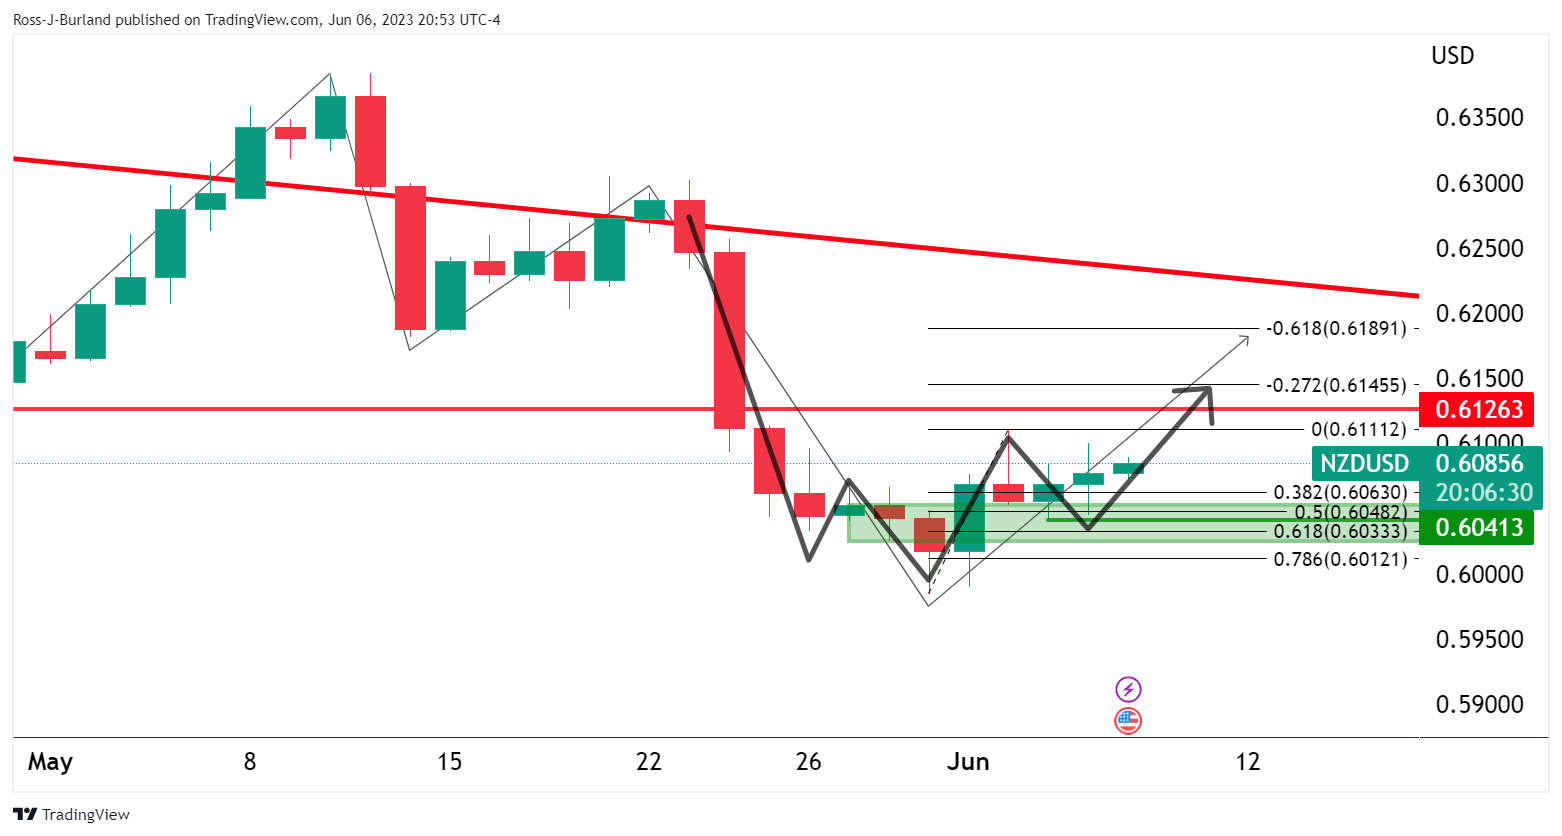
The correction was a 50% mean reversion that has held the test of time and bulls stay in control.
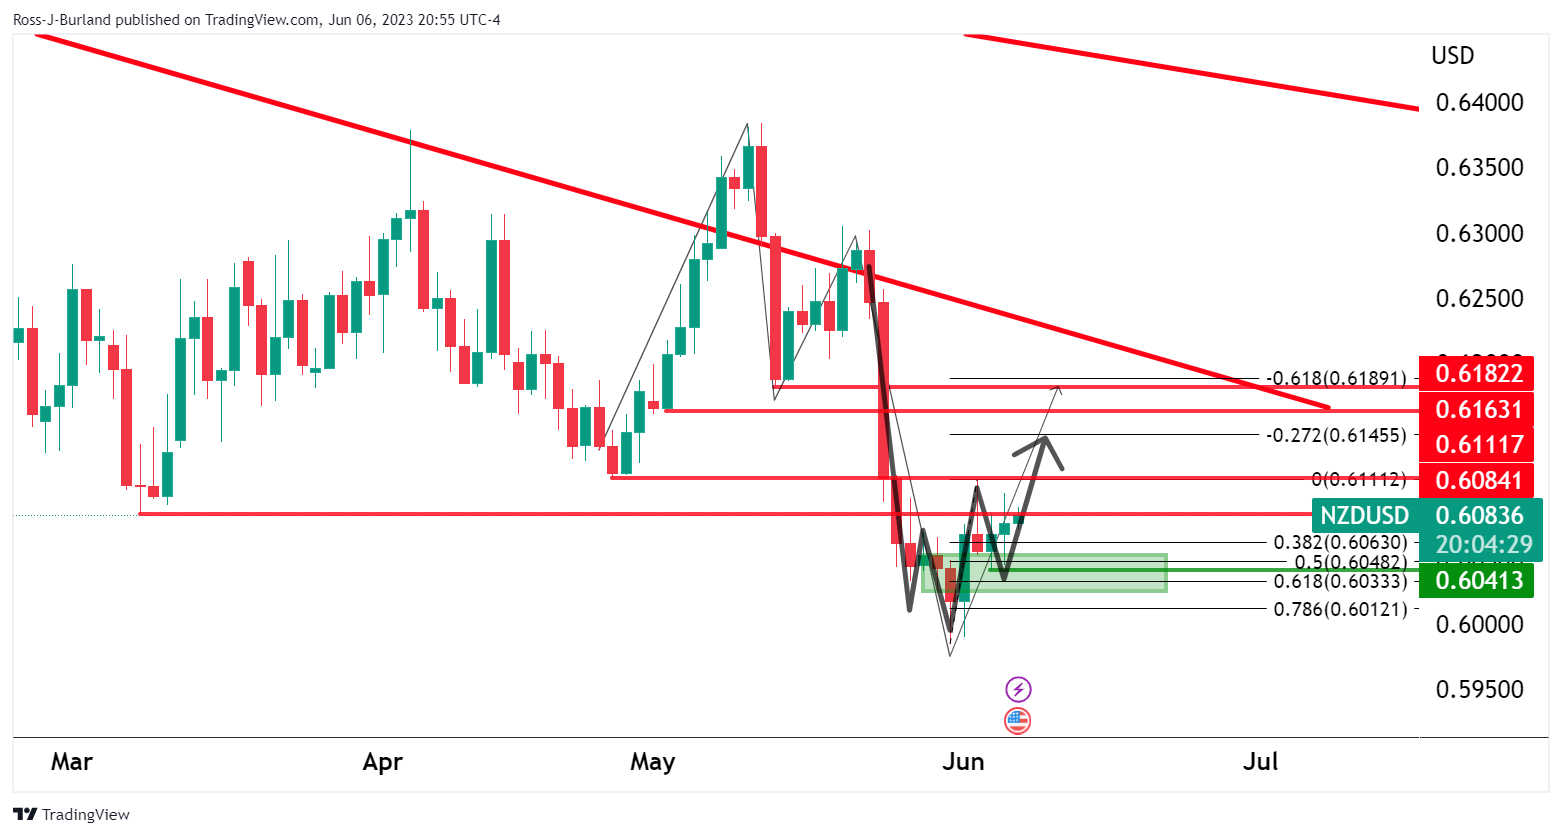
The levels to watch on the upside are highlighted above.

Comments are closed.