
- Gold price looks vulnerable above $2,000.00 as Fed to raise rates further.
- US equities are expected to remain stock-specific amid quarterly results season.
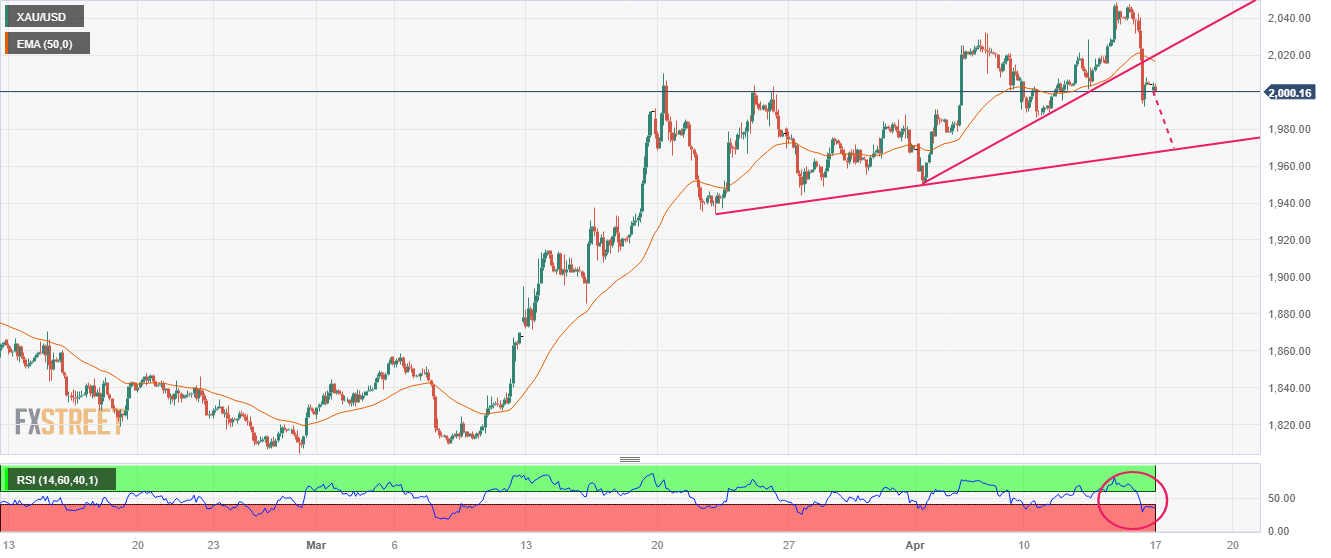
- Gold price is expected to decline further towards the upward-sloping trendline plotted from $1,934.34.
Gold price (XAU/USD) is looking vulnerable above the psychological resistance of $2,000.00 in the Asian session. The precious metal has shown a recovery move after printing a four-day low of $1,992.50. However, the recovery move looks fragile as the upside is capped due to bullish bets for the US Dollar Index (DXY).
The USD Index is looking to extend its recovery above the immediate resistance of 101.75 as the likelihood of a consecutive 25 basis point (bp) rate hike from the Federal Reserve (Fed) is extremely solid. The result from the CME Fedwatch tool conveys that the chances of a rate hike are almost 80%.
Meanwhile, S&P500 futures have added significant gains on early Monday after a mild sell-off on Friday. US equities are expected to remain stock-specific amid quarterly results season. Manufacturing and oil dependent companies could show some decent recovery in earnings as gasoline prices were extremely lower in March.
The demand for US government bonds has dropped significantly amid soaring bets for further policy restrictions by the Fed. Atlanta Fed President Raphael Bostic, said one more quarter-percentage-point interest rate hike can allow the Fed to end its tightening cycle with some confidence that inflation will steadily return to its 2% target.
Gold technical analysis
Gold price witnessed a steep fall after failing to test the critical resistance of $2,050.00 on Thursday. The yellow metal corrected sharply and dropped below the upward-sloping trendline plotted from April 03 low at $1,950.52. The Gold price is expected to decline further towards the advancing trendline placed from March 22 low at $1,934.34.
The precious metal has dropped below the 50-period Exponential Moving Average (EMA) at $2,016.83, which indicates that the short-term trend has turned bearish.
Meanwhile, the Relative Strength Index (RSI) (14) has slipped into the bearish range of 20.00-40.00, indicating more weakness ahead.
Gold two-hour chart

Comments are closed.