XAU/USD Price Forecast: Gold Looks to Powell
GOLD OUTLOOK & ANALYSIS
- Fed Chair Powell Testimony to dominate headlines later today.
- Gold bulls seek out volatility and dovish bias from Fed.
- Key technical indications for both weekly and daily charts.
Recommended by Warren Venketas
Get Your Free Gold Forecast
XAU/USD FUNDAMENTAL FORECAST
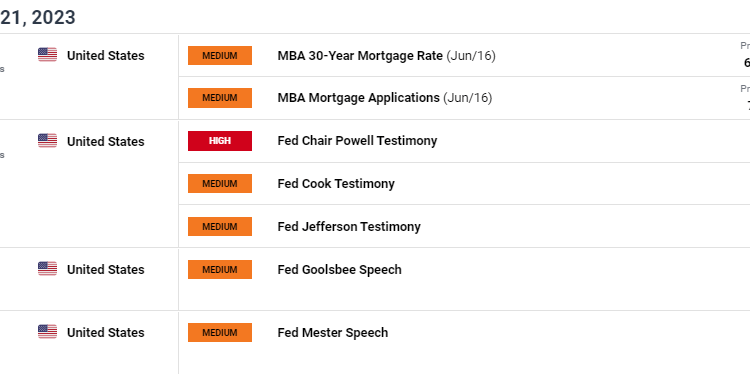
Gold prices have been relatively subdued of recent as markets continue to mull over the recent Fed interest rate pause as well as incoming economic data with particular focus on inflation and labor. The day ahead should stoke some volatility in gold markets with Fed Chair Jerome Powell scheduled to testify before the U.S. House Financial Services Committee (see economic calendar below) where he will submit the Semiannual Monetary Policy Report to Congress. It is expected that Fed Chair Powell will be questioned on the Fed’s monetary policy actions and implications thereof. Additional Fed officials will also be present to testify and may present investors with a clearer picture going forward.
Trade Smarter – Sign up for the DailyFX Newsletter
Receive timely and compelling market commentary from the DailyFX team
Subscribe to Newsletter
GOLD ECONOMIC CALENDAR (GMT +02:00)
Source: DailyFX economic calendar
Currently, markets are pricing in just under 25bps of additional rate hikes (see table below) for the November meeting but data dependency remains extremely important, leaving the door open for a sustained pause or greater rate hikes.
FEDERAL RESERVE INTEREST RATE PROBABILITIES

Source: Refinitiv
The GVZ or gold price volatility shown in the graphic below is a measure of market’s expected 30-day price movement in the SPDRGold ETF(GLD). Traditionally, most assets tend to move inversely to volatility but gold is one such exception. The graph shows a steady decline in the GVZ reading, correlating with gold’s recent downward trend. Should Fed Chair Powell’s testimony provide little in the way of new or unexpected information, bullion may well extend this downside move.
Foundational Trading Knowledge
Macro Fundamentals
Recommended by Warren Venketas
CBOE GOLD ETF VOLATILITY INDEX (GVZ)
Source: cboe.com
TECHNICAL ANALYSIS
GOLD PRICE WEEKLY CHART

Chart prepared by Warren Venketas, IG
Weekly XAU/USD price action is of particular focus this week as the medium-term trendline support (black) could be breached for the first time. Last week saw bulls marginally push above this level but may not be so fortunate this time around. A confirmation weekly candle close below this area of confluence could spark a large move lower for spot gold.
GOLD PRICE DAILY CHART
Chart prepared by Warren Venketas, IG
The short-term daily chart above outlines the consolidatory move over recent weeks as daily candles form a rectangle type chart pattern. Investors will be looking for a confirmation close (breakout) above or below rectangle resistance/support respectively as a guide to short-term directional bias.
Resistance levels:
- 50-day MA (yellow)
- Rectangle resistance
- 1950.00
Support levels:
- 1925.06
- Rectangle support
- 1900.00
IG CLIENT SENTIMENT: BEARISH
IGCS shows retail traders are currently distinctly LONG on gold, with 75% of traders currently holding long positions (as of this writing). At DailyFX we typically take a contrarian view to crowd sentiment resulting in a short-term downside disposition.
Contact and followWarrenon Twitter:@WVenketas


Comments are closed.