

- Gold price has shown topsy-turvy moves above $1,943.00 amid a less volatile action due to the long weekend.
- Fresh incoming data from US economic indicators are hinting at a sharp rise in demand-pull inflation.
- Gold price has again shifted into a volatility contraction and is expected to deliver more downside ahead.
Gold price (XAU/USD) is displaying topsy-turvy moves above $1,943.00 in the early Asian session. The precious metal is expected to extend its downside journey after an intermediate inventory adjustment phase as the Federal Reserve (Fed) is expected to make more interest rate hikes in June meeting certain amid resilient households' spending in the United States.
Earlier, Fed chair Jerome Powell cited that more rate hikes seem less certain as tight credit conditions by US regional banks are effectively restricting inflation. However, fresh incoming data from economic indicators is hinting at a sharp rise in demand-pull inflation.
S&P500 futures are showing gains in early Asia, portraying a risk appetite theme as fears of a default by the US economy have receded. US President Joe Biden made clear on Monday that the agreed proposal between the White House and Republicans is going to Congress for voting before the deadline of June 05.
The US Dollar Index (DXY) is facing barricades in extending its recovery above 104.30. Investors should brace for a volatile action ahead as US markets will open after a long weekend, therefore, investors would first wrap up their positions. Apart from that, investors would shift their focus towards JOLTS Jobs Openings data, which will release on Wednesday along with Fed’s Beige Book. As per the consensus, job openings are expected to fall to 9.35M vs. the prior release of 9.59M.
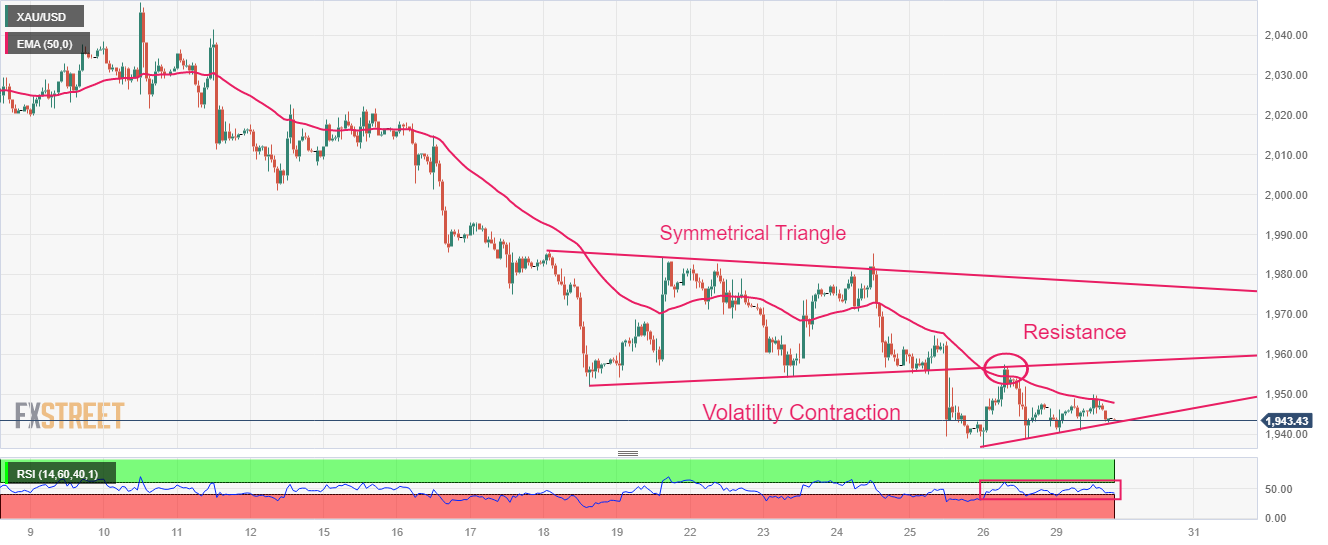
Gold technical analysis
Gold price displayed a downside move after a breakdown of the Symmetrical Triangle chart pattern on an hourly scale. The precious metal has sensed immense selling pressure after a pullback move to near $1,957.82. The yellow metal has again shifted into a volatility contraction and is expected to deliver more downside ahead.
The 50-period Exponential Moving Average (EMA) at $1,948.00 is barricading the upside of the Gold price.
Meanwhile, the Relative Strength Index (RSI) (14) is oscillating in the 40.00-60.00 range. A breakdown below 40.00 will trigger the downside momentum.
Gold hourly chart
Comments are closed.