XAU/USD bears lurking as right shoulder forming
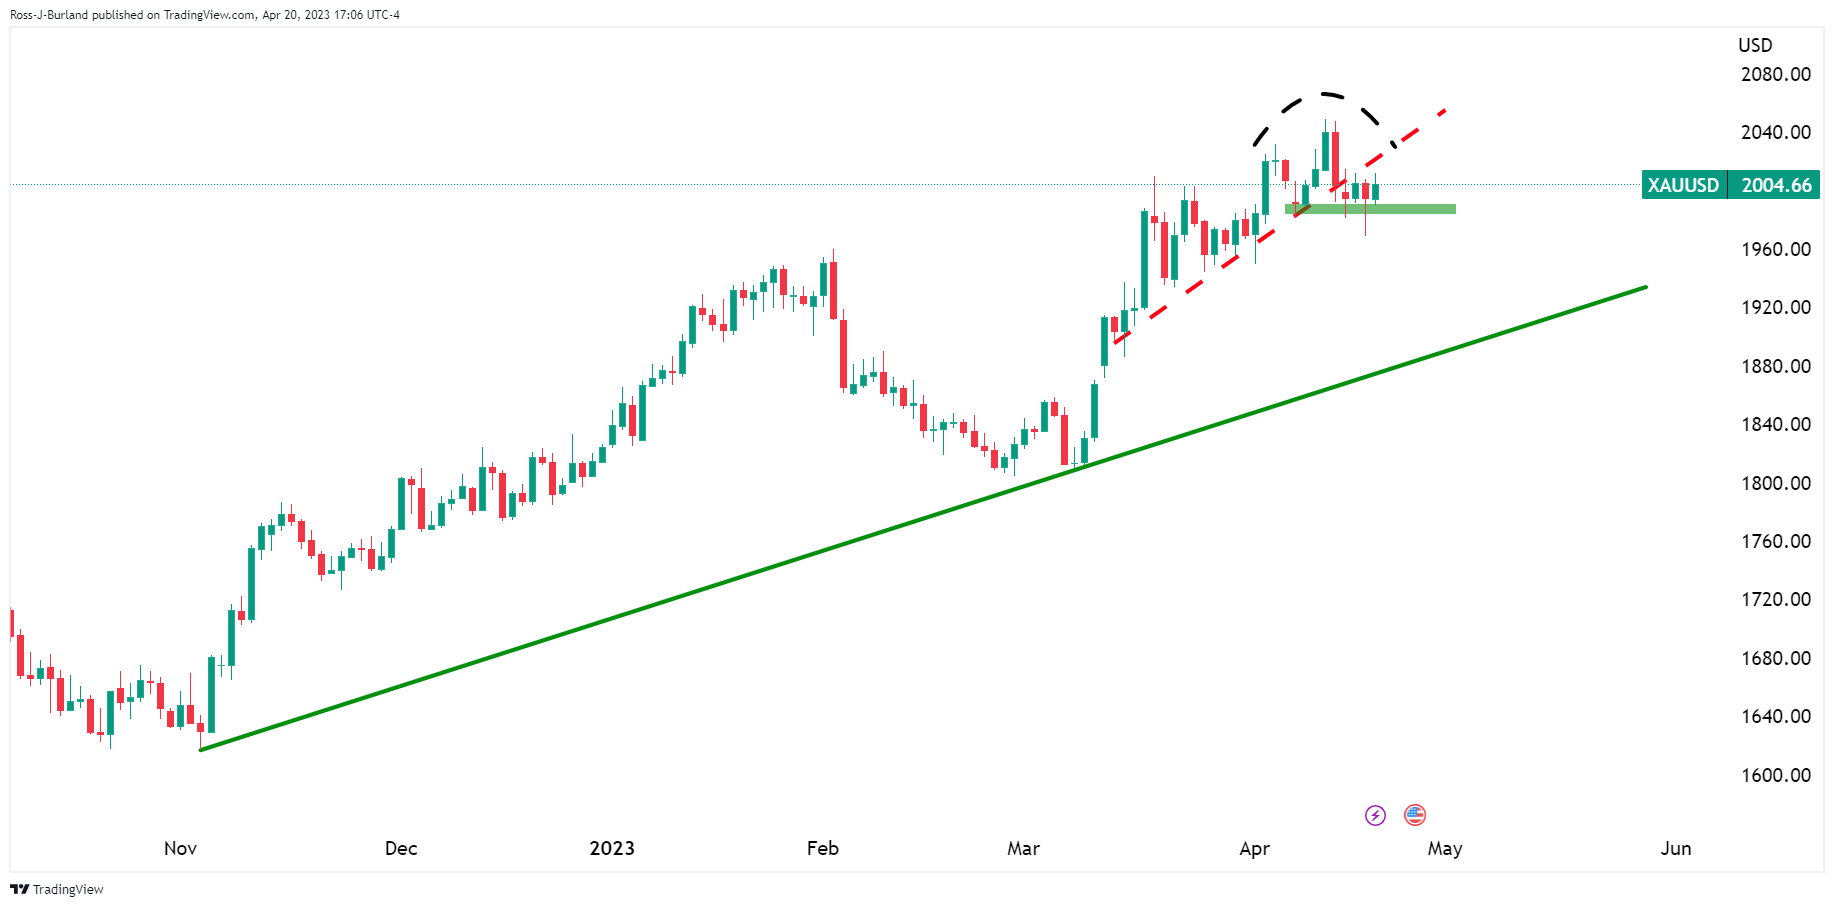
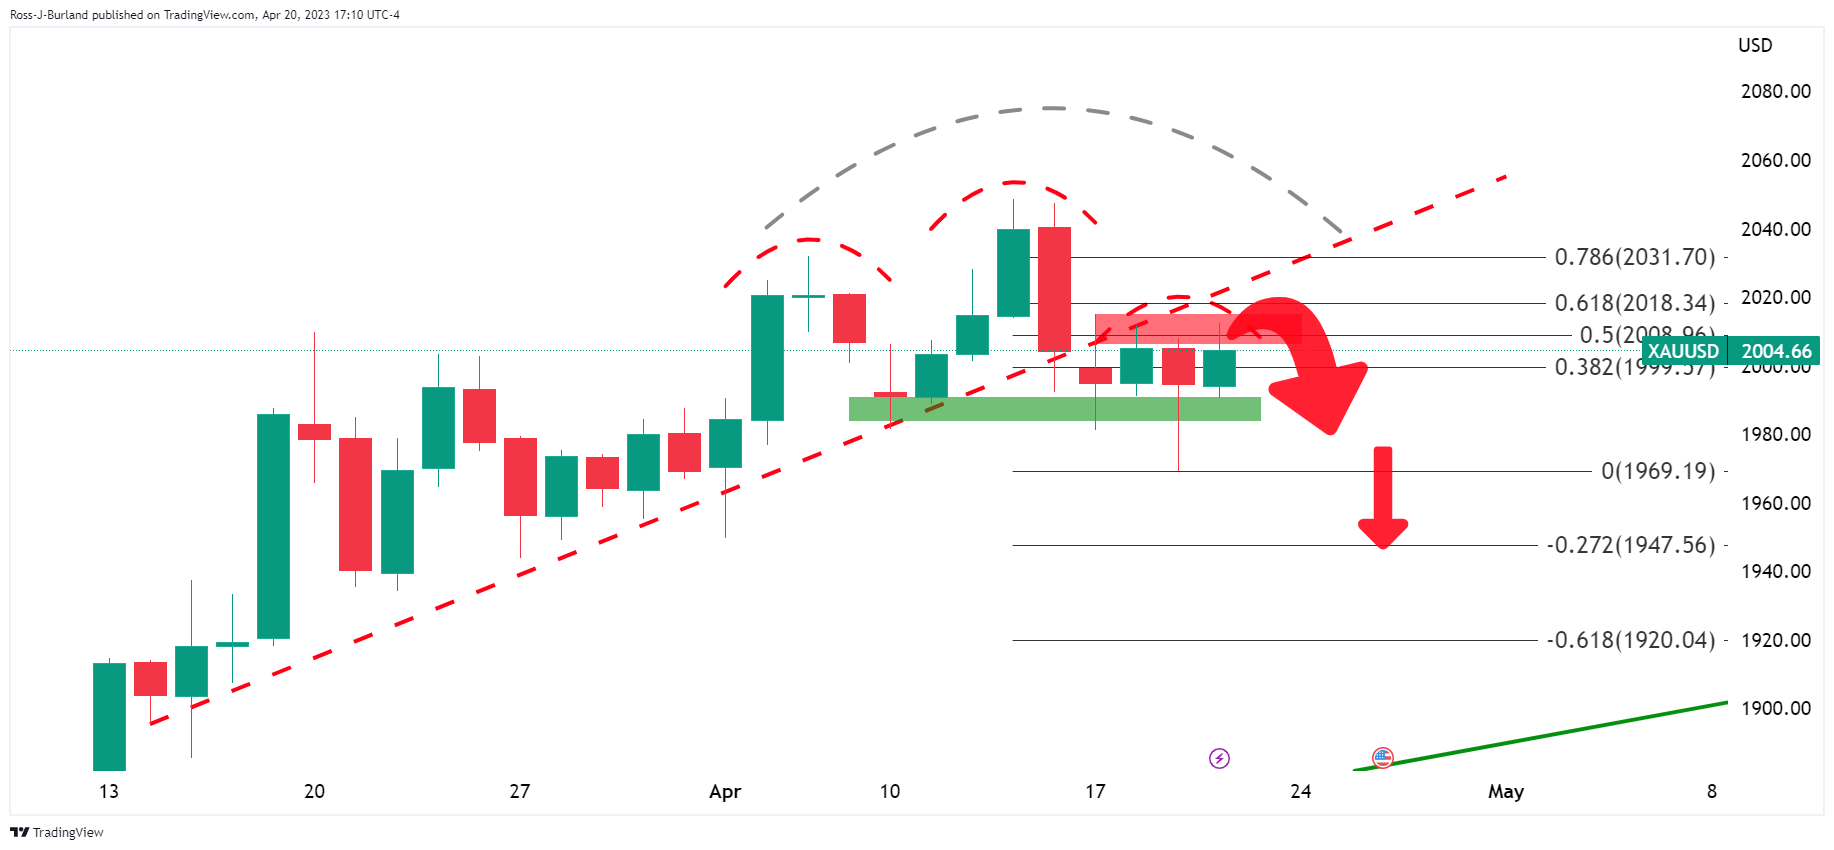
- Gold price forming a Head & Shoulders toppìng formation on the daily chart.
- US data, US Treasury yields, and Federal Reserve sentiment is Gold price the driving force.
The Gold price, XAU/USD, is up around 0.5% near $2,005 and has traveled between a low of $1,990.56 and a high of $2,012.44 so far on Thursday. The price is clustered in a phase of consolidation on the backside of the bullish trend as illustrated in the technical analysis below.
Gold price fundas
Meanwhile, the fundamentals that are playing in surround the state of the US economy and how that is affecting US yields. The yield on the US 10-year note dropped 4bp to 3.55% as the softer Beige Book drove a strong rally in back-month fed fund futures. The moves have supported a bullish correction in the Gold price as the US Dollar fell, as per the DXY index, to a low of 101.632 from a high of 102.126.
Meanwhile, the futures pricing has shown a 90% chance the Federal Reserve will hike rates 25 basis points when policymakers conclude a two-day meeting on May 3, according to CME's FedWatch Tool. In recent Fed speak, Federal Reserve´s Governor Christopher Waller said on Friday that despite a year of aggressive rate increases, the Fed “hasn't made much progress” in returning inflation to their 2% target and argued that rates still need to go up. As such, the likelihood of a rate cut by December has narrowed considerably this week.
Looking ahead, the Federal Open Market Committee will enter a blackout this weekend ahead of the 2/3 May meeting. The latest guidance is very much in line with market pricing and Atlanta Federal Reserve President Bostic said that he favors one more 25bp rate hike and then a pause. Bostic explained that tightening in credit conditions could do some of the Fed’s work. ´´The Atlanta Fed has historically been seen, rightly or wrongly, as a barometer of consensus on the FOMC,´´ analysts at ANZ Bank said.
Federal Reserve Bank of New York President John Williams also said on Wednesday inflation was still at problematic levels, and the US central bank would act to lower it. Looking ahead, the Federal Open Market Committee will enter a blackout this weekend ahead of the 2/3 May meeting.
Meanwhile, analysts at TD Securities explained that the Gold price managed to fend off a break below key trigger levels for CTA liquidations. ´´Retail demand has remained particularly strong following the banking liquidity crisis, but easing fears could see interest subside amid higher prices.´´
´´While slumping rates likely kept gold bulls from liquidating,´´ the analysts said, ´´discretionary traders remain broadly flat, CTAs are still effectively near max long, and Shanghai trade positioning is also near multi-year highs — leaving fewer culprits for the surprising buying activity over the last session.´´
´´In this context, central bank demand remains key to a continued rally, and has shown few signs of buyer fatigue, but ‘unofficial' holdings estimates which have been particularly important over the last quarters will only be updated in May,´´ the analysts argued.
Gold price technical analysis

As illustrated above and below, we could have a topping pattern in place for the Gold price.
Gold price H4 chart

The Gold price has slid to the backside of the trendline support and a break of the neckline horizontal support of the Gold price Head & Shoulders pattern is needed to switch the bias fully negative from out of the consolidation.


Comments are closed.