XAG/USD tanks as the US Dollar stages a comeback, despite poor US data
- XAG/USD drops from around $25.40s to $24.10s as US inflation cools and the labor market eases.
- The RSI indicator and 3-day RoC portray a bearish outlook for Silver, with the 200-DMA on sight.
Silver price plummets across the board, as data from the United States (US) showed that inflation is cooling down, while the labor market commences easing amidst US Federal Reserve (Fed) officials complaining about its tightness. US Treasury bond yields drop, but the US Dollar (USD) rises to new weekly highs, a headwind for XAG/USD prices. At the time of writing, the XAG/USD is trading at around $24.20, slides 4.50%.
XAG/USD Price Analysis: Technical outlook
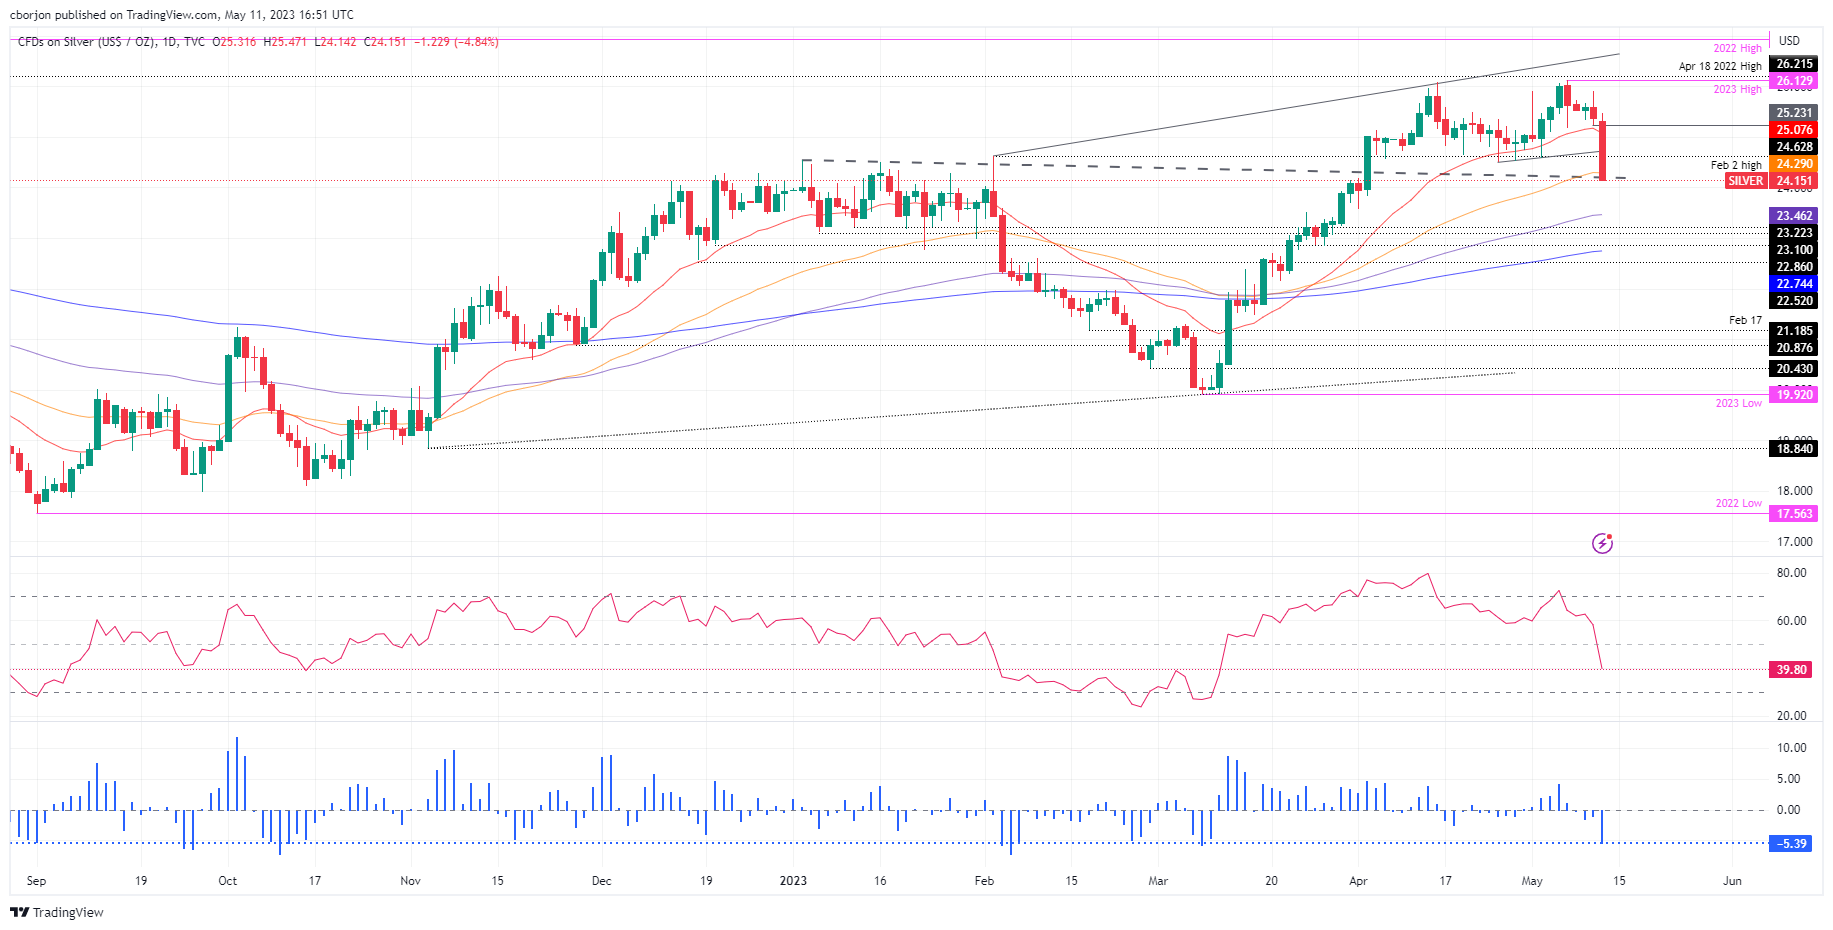
The XAG/USD collapse dragged prices into testing the 50-day Exponential Moving Average (EMA), breaking on its way south two crucial support levels: firstly, the 20-day EMA gave way around $25.08, secondly the break of the two-week support trendline at around $24.63, which, accelerated the white metal downtrend, towards testing additional key support levels.
Silver is challenging a five-month-old previous resistance trendline, turned support at around $24.20, which, once broken, the XAG/USD could drop to the $24.00 figure, followed by the 100-day EMA at $23.46. A breach of the latter will expose the 200-day EMA at $22.74.
Conversely, if XAG/USD reclaims $24.63, that could pave the way toward $25.00 a troy ounce. That would form a bullish hammer, shifting Silver’s bias to the upside, and it might open the door to test the year-to-date (YTD) high of $26.13.
The Relative Strength Index (RSI) indicator turned bearish after crossing the 50-midline. The 3-day Rate of Change (RoC) portrays sellers in charge as the XAG/USD extends its slide throughout the day.
XAG/USD Price Action – Daily Chart


Comments are closed.