XAG/USD struggles to reclaim ground, and turns bearish below the 200-DMA
- Silver price sees a minor gain of 0.50% but fails to reclaim the May 26 daily low, resulting in a bearish outlook.
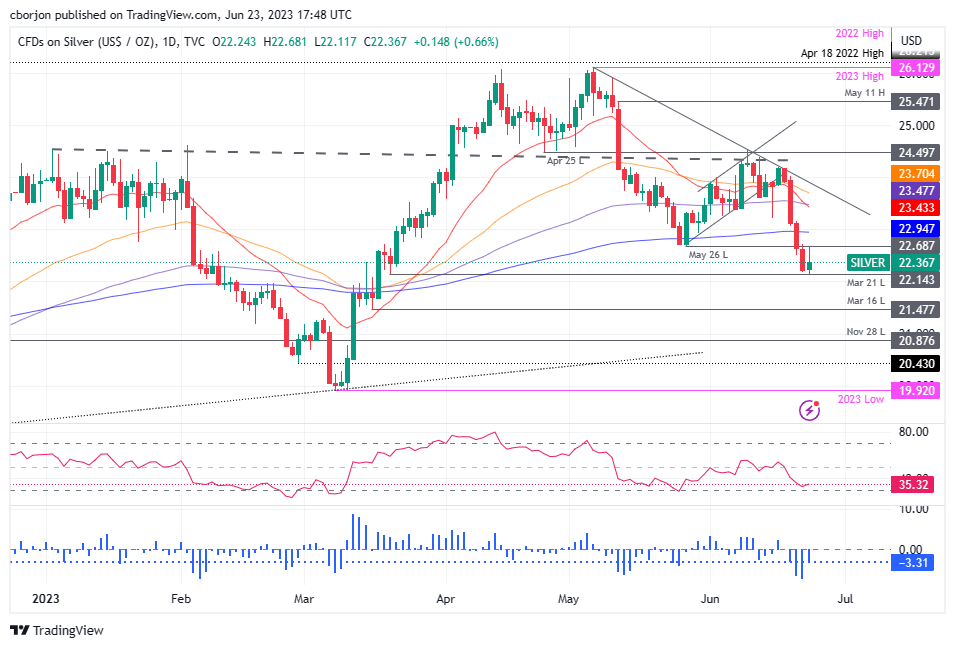
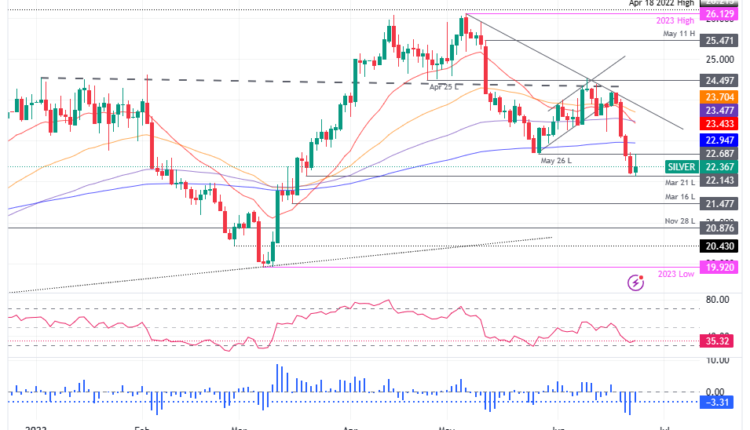
- The technical analysis shows support at the March 21 daily low of $22.14; breaking this could see a drop below the $22.00 figure.
- Potential resistance lies at the May 26 low-turned resistance at $22.68, with the 200-day EMA at $22.94 and $23.00 as the next challenges.
Silver price remains firm in the session but could not reclaim the May 26 daily low; previous support turned resistance and also below the 200-day Exponential Moving Average (EMA). Therefore, the XAG/USD turned bearish from a technical perspective. The XAG/USD is trading at $22.32, a gain of 0.50%.
Must read: Gold Price Forecast: XAU/USD rebounds amid recession fears, slowing global economic growth
XAG/USD Price Analysis: Technical outlook
Silver is downward biased but must break support at the March 21 daily low of $22.14 on its way toward dropping below the $22.00 figure. Even though the XAG/USD fell to a new three-month high, cheered by sellers, the XAG/USD could remain trading sideways, within the $22.10/$22.69 area without a catalyst.
If XAG/USD slumps below $22.00, the next support will lie at the March 16 low of $21.46 before exposing the $21.00 figure and the November 28 daily low at $20.87. On the flip side, the XAG/USD stays above $22.00. The next resistance would be the May 26 low-turned resistance at $22.68, followed by the 200-day EMA at $22.94 ahead of challenging $23.00.
From an oscillator point of view, the Relative Strength Index (RSI) shows signs of bearishness, while the three-day Rate of Change (RoC) portrays sellers losing some momentum but remaining in charge.
XAG/USD Price Action – Daily chart


Comments are closed.