XAG/USD climbs back above $23.00, upside potential seems limited
- Silver gains positive traction and snaps an eight-day losing streak to over a two-week low.
- The technical setup supports prospects for the emergence of fresh selling at higher levels.
- Bears might wait for a fall below the $22.85-80 region before positioning for further decline.
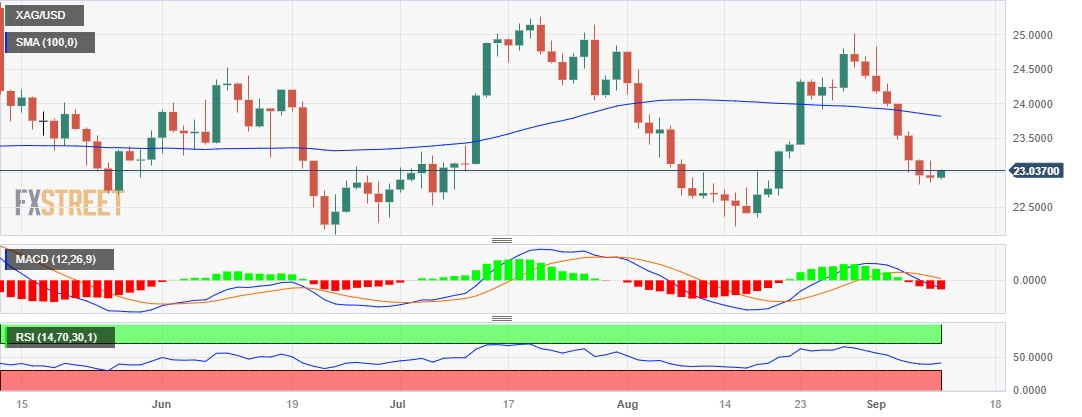
Silver attracts some buyers on the first day of a new week, snapping an eight-day losing streak, and climbs back above the $23.00 round-figure mark during the Asian session. The white metal, however, remains well within the striking distance of a two-and-half-week low, around the $22.85-$22.80 region retested on Friday, and still seems vulnerable to slide further.
The negative outlook is reinforced by the fact that oscillators on the daily chart have been gaining negative traction and are away from being in the oversold zone. Moreover, the Relative Strength Index (RSI) on the 4-hour chart has also recovered from the oversold territory. This, in turn, suggests that the path of least resistance for the XAG/USD remains to the downside.
Hence, any subsequent move up might still be seen as a selling opportunity and remain capped near the very important 200-day Simple Moving Average (SMA), currently pegged near the $23.45-$23.50 area. This is followed by the 100-day SMA barrier, around the $23.80 region, and the $24.00 mark, which if cleared decisively will negate the negative outlook for the XAG/USD.
The subsequent short-covering move has the potential to lift the white metal beyond the $24.30-$24.35 supply zone, towards reclaiming the $25.00 psychological mark. The latter represents the August monthly swing high and should act as a pivotal point. A sustained strength beyond will be seen as a fresh trigger for bullish traders and pave the way for a further appreciating move.
On the flip side, bearish traders need to wait for some follow-through selling below the $22.85-$22.80 area before placing fresh bets. The XAG/USD might then accelerate the fall below the $22.65-$22.60 support, towards challenging a strong horizontal support near the $22.20-$22.10 zone. This is followed by the $22.00 mark, which if broken will confirm a fresh breakdown.
Silver daily chart

Technical levels to watch


Comments are closed.