XAG/USD bulls await sustained move beyond $23.00/38.2% Fibo.
- Silver attracts some buyers for the third straight day, though remains below $23.00.
- The technical setup favours bullish traders and supports prospects for further gains.
- A convincing break below the $22.70-65 confluence will negate the positive outlook.
Silver trades with a mild positive bias for the third successive day on Tuesday, albeit lacks follow-through and remains below the $23.00 mark through the early European session.
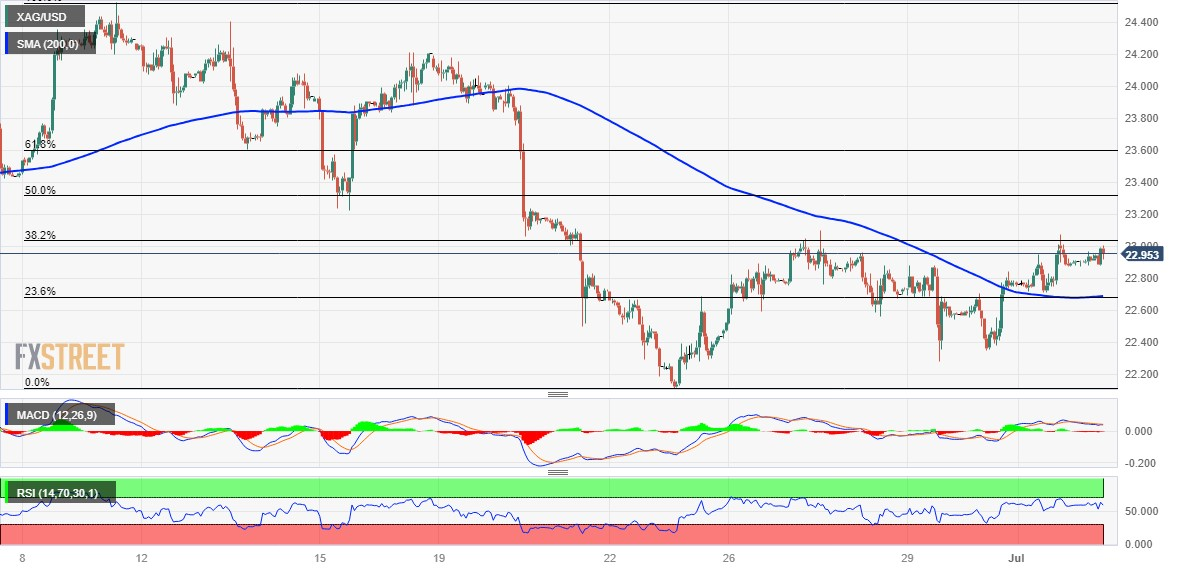
From a technical perspective, the recent breakout through the $22.65-$22.70 confluence – comprising the 200-hour Simple Moving Average (SMA) and the 23.6% Fibonacci retracement level of the downfall from the June swing high – favours bullish traders. Moreover, oscillators on hourly charts are holding in the positive territory and are still far from being in the overbought zone, supporting prospects for some meaningful appreciating move for the XAG/USD.
That said, technical indicators on the daily chart – though have been recovering from lower levels – are yet to confirm the positive outlook and warrant some caution. This makes it prudent to wait for sustaiend strength and acceptance beyond the $23.00 mark, nearing the 38.2% Fibo. level, before placing fresh bullish bets. This is followed by the $23.30 area, or the 50% Fibo., which if cleared decisively might trigger a fresh bout of a short-covering around the XAG/USD.
The subsequent move up has the potential to lift the white metal beyond the $23.60 intermediate hurdle, or the 61.8% Fibo. level, towards reclaiming the $24.00 round-figure mark. The upward trajectory could get extended further towards the $24.25 resistance en route to the $24.45-$24.50 supply zone, or the June monthly swing high.
On the flip side, the $22.70-$22.65 confluence resistance breakpoint now seems to protect the immediate downside. A convincing break below will be seen as a fresh trigger for bearish traders and drag the XAG/USD back towards the multi-month low, around the $22.10 region touched in June. Some follow-through selling below the $22.00 mark should pave the way for deeper losses towards the $21.70-$21.65 zone en route to the $21.25 support and the $21.00 mark.
Silver 1-hour chart

Key levels to watch


Comments are closed.