
Weekly Technical Outlook: Key Resistance Levels for Amazon, Polygon (MATIC/USD) And GBP/USD
Amazon, Polygon (MATIC/USD), and GBP/USD are hitting major resistance levels on their daily time frames!
Will we see rejections in the next few days? Or can bulls execute breakouts for them assets?
Let’s take a closer look at their charts!
Amazon.com, Inc (AMZN): Daily

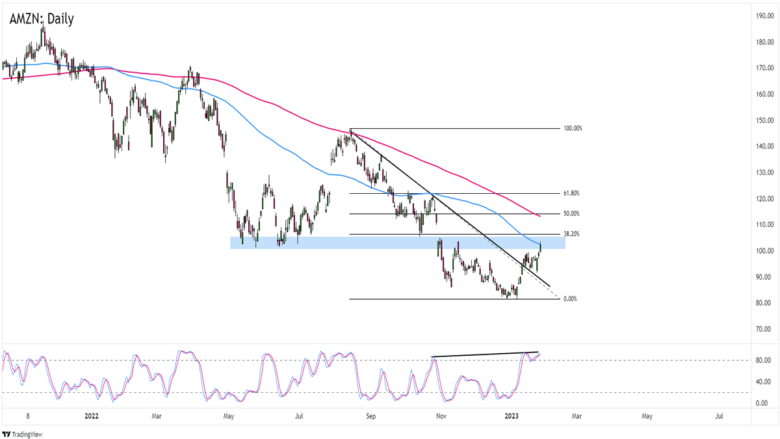
Amazon.com, Inc (AMZN) Daily Chart by TradingView
Breakout alert! In case you didn’t notice, Amazon broke above a months-long trend line resistance a few weeks ago.
But before you price in the reversal of a long-term downtrend, you should also note that the stock is approaching the tricky 102.00 – 107.00 zone that may rain on the bulls’ parade.
See, the area lines up with a key support in June and then in October, which is also close to the 38.2% Fibonacci retracement level of September to December’s downswing.
It also doesn’t help that AMZN is testing the daily chart’s 100 SMA just as price is showing a bearish divergence with Stochastic.
A rejection from the 100 SMA opens AMZN to a dip back to its broken trend line levels if not December’s lows.
But if the stock extends its January upswing, then we could see a trip to the 114.00 zone near the 200 SMA or even the 120.00 previous inflection point!

Polygon (MATIC/USD) Daily Chart by TradingView
Feelin’ like trading crypto these days?
Take a look at Polygon (MATIC/USD), which is consolidating at the 1.1775 area that marks the top of a range on the daily time frame.
What makes the technical setup more interesting is that the chart is showing a lowkey bearish divergence while price is having trouble making new monthly highs.
A break above the range that we’re watching could push MATIC/USD to the 1.3000 November highs. It could even revisit the 1.4650 and 1.7000 previous areas of interest if there’s enough momentum!
Meanwhile, a rejection at the range resistance may drag MATIC/USD back to the 1.0000 mid-range levels if not the .8000 range support zone.
What do you think? Which way will MATIC go?

GBP/USD Daily Forex Chart by TradingView
Hollah if you’re a forex playa!
GBP/USD is poppin’ up a potential Double Top pattern as it consolidates at the 1.2450 previous resistance area.
Stochastic is on the bears’ side as it hangs out in the “overbought” territory on the daily time frame.
It doesn’t look like GBP bulls and bears have decided on the pair’s next direction yet, so y’all might want to take the time to make and review your trading plans before trading this one.
If GBP/USD breaks above January’s highs, then the 100 SMA could cross above the 200 SMA and herald a longer-term reversal.
But if GBP/USD breaks below its current consolidation, then we could see a retest of the 1.1900 “neckline” or maybe even an extension of GBP/USD’s longer-term downtrend.
Comments are closed.