

User Manual EA Ultra KZM v 1.2.1
CONTENTS
- Concept and principle of system
- Demonstration of system
- Functions in EA
- How to install indicator ” True different pair”
- How to set up EA and description of parameters
- Description of user interface
- Instruction of setting
- Requirements
- Features
Concept and principle of system
We need to understand the meaning of graph named “True Difference Pair” before we go to the other contents. This graph
is very important which is the basis to understand everything in this EA !!!
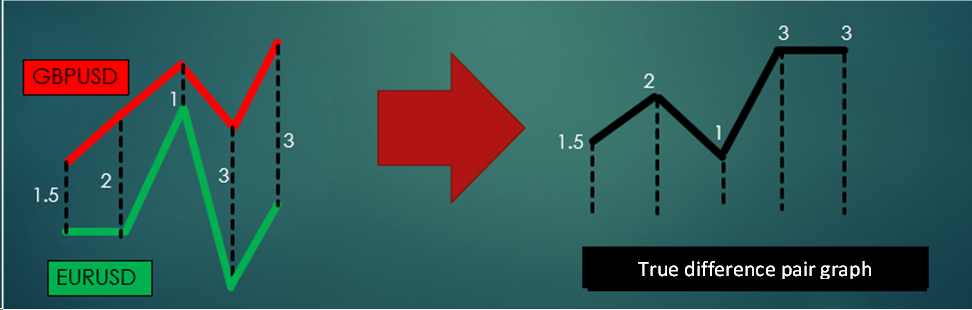
“True difference pair” is the graph that represents the distance between 2 currency graph and convert into pip. You can see from above figure that GBPUSD graph is red and EURUSD graph is green and True Difference Pair graph is black which represents the distance between red graph and green graph. We call black graph as “True Difference Pair graph of group GBPUSD/EURUSD”.
From above figure
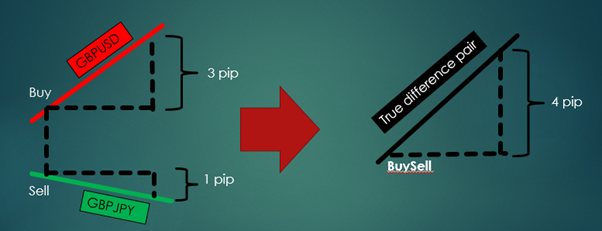
When we BuySell (Buy GBPUSD and Sell GBPJPY at the same time) and afterwards GBPUSD graph increase 3 pip and GBPJPY graph decrease 1pip. It means that we earn profits 4 pip (3+1=4). Let’s take a look at True Difference Pair graph. It’s also increase 4 pip (because distance between GBPUSD graph and GBPJPY graph increase 4 pip).
Conclusion: When we BuySell and then True Difference Pair graph increase X pip . This means that we earn profits X pip. In contrast, if we BuySell but then True Difference Pair graph decrease X pip. This means that we loss X pip.
From above figure
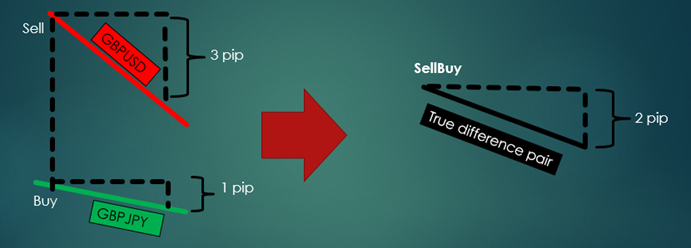
When we SellBuy (Sell GBPUSD and Buy GBPJPY at the same time) and afterwards GBPUSD graph decrease 3 pip and GBPJPY graph decrease 1pip. It means that we earn profits 2 pip (3-1=2). Let’s take a look at True Difference Pair graph. It’s also decrease 2 pip (Because distance between GBPUSD graph and GBPJPY graph decrease 2 pip).
Conclusion: When we SellBuy and then True Difference Pair graph decrease X pip . This means that we earn profits X pip. In contrast, if we SellBuy but then True Difference Pair graph increase X pip. This means that we loss X pip.
After we understand the meaning of True Difference Pair graph. Next question is how can we make a profit from this graph?
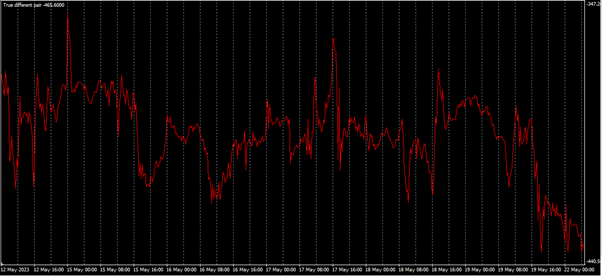
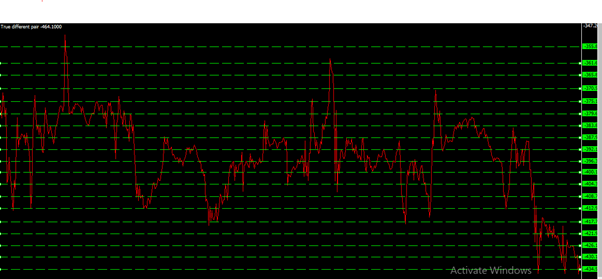
Above figure show True Difference Pair graph of some group (2 pairs) that having high correlation (near 100%). You can see that this graph has very sideways trend more than common currency graph. Thus, it’s very suitable to apply grid system into this graph as below figure.
Demonstration of system
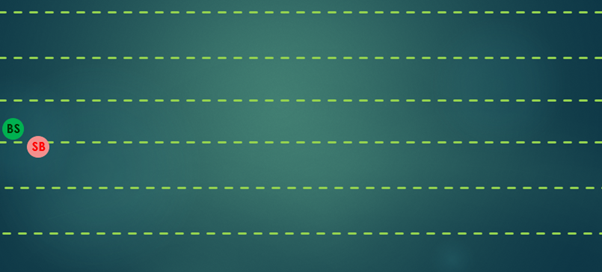
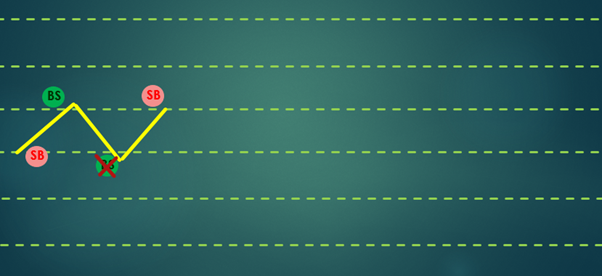
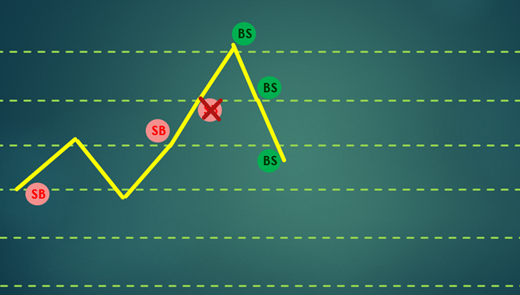
We start with BuySell and SellBuy simultaneously.
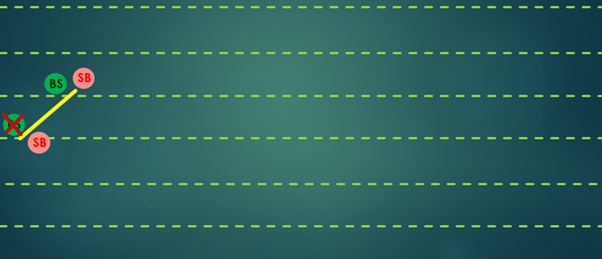
If we set the distance of TP (Take profit) equal to distance between grid. When True Difference Pair graph (Yellow graph in above figure) increase and reach new grid. BuySell order (which is marked with a cross) will TP. Then, EA will place new order BuySell and SellBuy simultaneously at new grid.
****Note that this grid apply to True Difference Pair graph not currency graph.**
When True Difference Pair graph decrease again and reach to new grid. SellBuy (which is marked with a cross) will TP. Then, EA will place new order BuySell at new grid. The reason why EA place only BuySell don’t place SellBuy because this grid had SellBuy already.
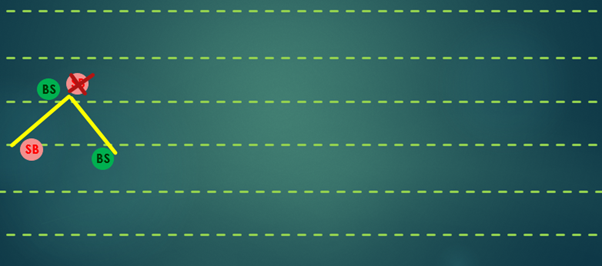
When True Difference Pair graph increase again and reach to new grid. BuySell(which is marked with a cross) will TP. Then, EA will place new order SellBuy at new grid. The reason why EA place only SellBuy don’t place BuySell because this grid had BuySell already.
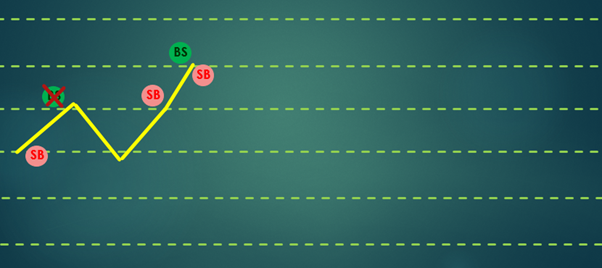
When True Difference Pair graph increase again and reach to new grid. BuySell(which is marked with a cross) will TP. Then, EA will place new order SellBuy and BuySell at new grid simultaneously.
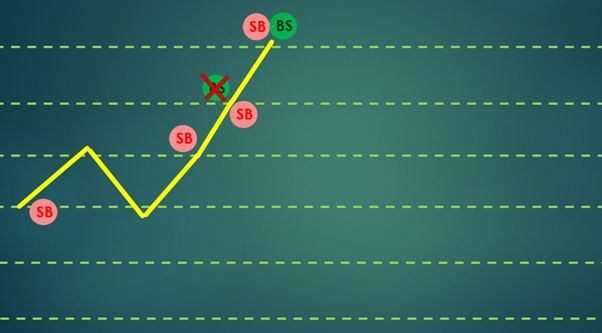
When True Difference Pair graph increase again and reach to new grid. BuySell(which is marked with a cross) will TP. Then, EA will place new order SellBuy and BuySell at new grid simultaneously.
When True Difference Pair graph decrease again and reach to new grid. SellBuy(which is marked with a cross) will TP. Then, EA will place new order BuySell at new grid. The reason why EA place only BuySell don’t place SellBuy because this grid had SellBuy already.
When True Difference Pair graph decrease again and reach to new grid. SellBuy(which is marked with a cross) will TP. Then, EA will place new order BuySell at new grid. The reason why EA place only BuySell don’t place SellBuy because this grid had SellBuy already.
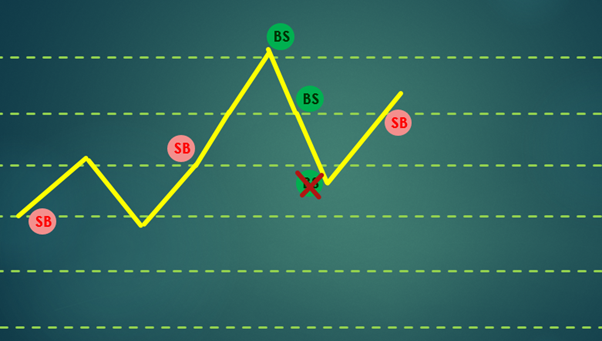
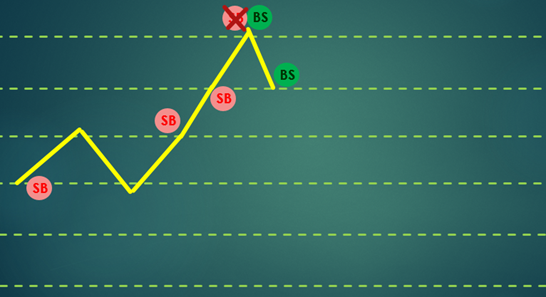
When True Difference Pair graph increase again and reach to new grid. BuySell(which is marked with a cross) will TP. Then, EA will place new order SellBuy at new grid. The reason why EA place only SellBuy don’t place BuySell because this grid had BuySell already.
EA do the same thing and will generate cash flow continuously.
Function clear orders from equity increase
When TDP graph (True Difference Pair graph) has strong downward trend (which is rarely happening). There will be many BuySell stucked at the top (See figure below).
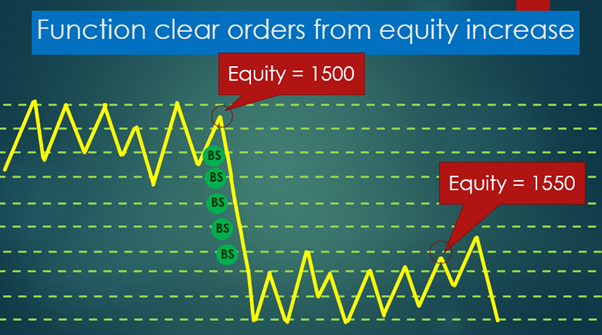
These BuySell orders will never close until TDP graph raise to the top again.
We have function “Clear orders from equity increase” for clearing these orders every time when equity increase to specified value.
From above figure, at early, TDP graph has sideways trend which we can generate cashflow constantly until equity=1500. Then graph decrease rapidly and has sideways trend at bottom which we can generate cashflow again. When equity reach 1550 , EA will clear all opened orders (in this case we determine value for clearing = 50 but we can use other values such as 85, EA will clear when equity reach 1585 instead).
Functions in EA
How to install Indicator “True different pair”
(EA Can run without installing indicator. Although indicator is not necessary to be installed but it suitable to the user who want to design or adjust strategy or specify the trading zone.)
You can download indicator “True different pair” from this link
https://drive.google.com/file/d/1g3K60W13ABh18DggsiuWGEZ8Qef4yhb0/view?usp=drive_link
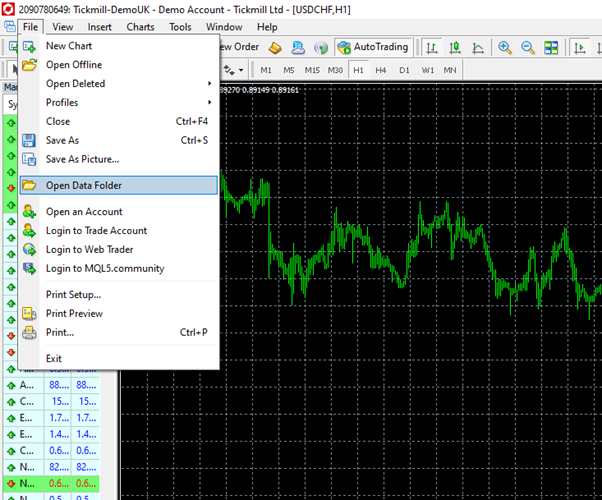
1.Click file —->Open Data Folder
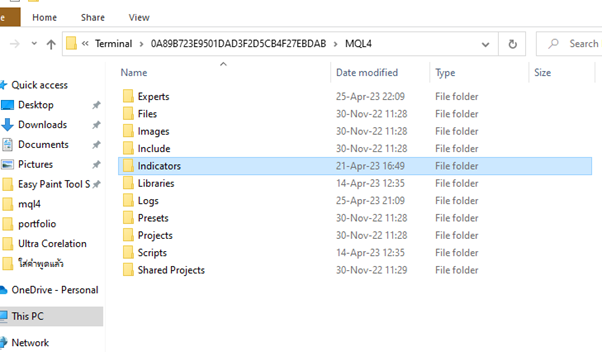
2. Click MQL4 folder
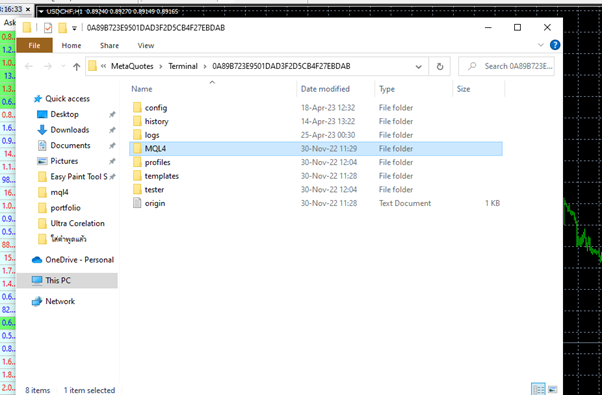
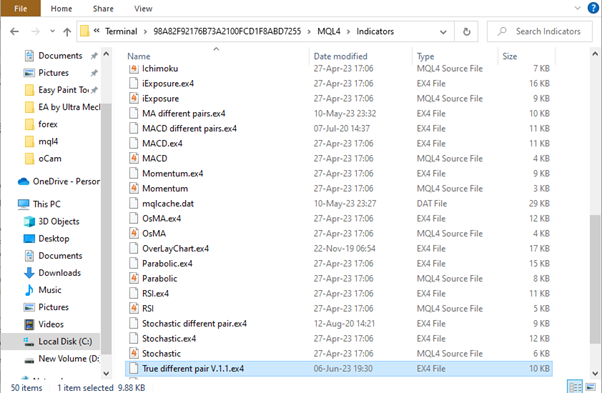
3. Click Indicators folder and put True Difference Pair.ex4 into it.
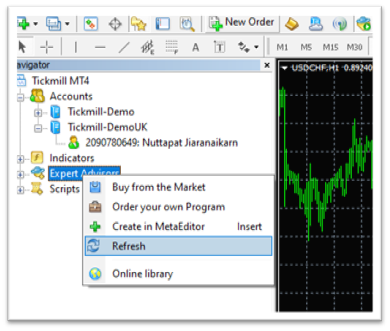
3. At Navigator tab. Right click at Expert Advisors and press refresh. EA and Indicator that we have installed will appear.
How to set up EA and Description of parameters
1.How to set up EA :
- Drag EA Ultra KZM from navigator into a chart (You can choose any chart but just only one chart!!!) and any timeframe (Every timeframe will give the same running result). At common tab, Tick following figure below.

2.Description of parameters
 Category <Line notify>
Category <General setting>
- Suffix of currency – For example, if the currency pair is “EURJPY#”, you type “#” if the currency pair is “EURJPYc”, you type“c” if the currency pair is “EURJPY”, you type nothing (just leave it).
- Currency group – 2 Currency pairs (1 Group) that we will run. There are 20 Groups for choosing but if you want to run besides these groups. You have to choose custom and specify the group by typing at parameters below (1st Currency and 2nd Currency ).
- 1st Currency – This will work when you choose “Currency group” above as Custom. It determines 1st Currency of the group.
- 2nd Currency – This will work when you choose “Currency group” above as Custom. It determines 2nd Currency of the group.
- Minimum margin level – The minimum margin level to open order (if margin level is less than specified value, EA will not open new order.
- Max spread for opening order (pip) – For example, if we type 3.5 when there is either pair of Group that having Spread more than 3.5 pip.
EA will not open new order. For example, if we run Group EURJPY_CHFJPY. When EURJPY has spread = 1.7 pip and CHFJPY has spread = 5.4 pip , EA will not open new order because CHFJPY has spread more than 3.5 pip. - Max spread for take profit (pip) – For example, if we type 3.5 when there is either pair of Group that having Spread more than 3.5 pip. EA will not take profit although it reach the position of TP. It has to wait until both pairs of group have Spread less than 3.5 pip EA will close order. This function can be useful to protect closing order with negative profit because when market nearly close, spread is very wide.
- Max difference of pip value – Max difference of pip value allowed to open order. For example, if we type 3 and run Group AUDCHF_AUDJPY which AUDCHF has pip value = 11.21 and AUDJPY has pip value=7.48 which the difference is 11.21-7.48=3.73>3. Thus, this group will not open any orders.
- Initial lot –Lot for opening order. For example, if we type 0.01 and run group GBPUSD_AUDUSD. EA will place BuySell (Buy GBPUSD with lot 0.01 and Sell AUDUSD with lot 0.01) or place SellBuy (Sell GBPUSD with lot 0.01 and Buy AUDUSD with lot 0.01)
- Use auto distance of grid and take profit – Use function auto distance of grid and take profit(true/false)? If you use this function EA will adjust distance between grid automacically depending on market volatility. This function will fix the distance of TP equal to the distance of grid for each order that open at that time.
- Distance of grid (pip) – Distance of grid (fixed) in pips. This will work when you choose above (Use auto distance of grid and take profit) = false.
- Take profit (pip) – TP of grid (fixed) in pips. This will work when you choose above (Use auto distance of grid and take profit) = false.
- Stoploss (pip) – Stoploss of grid (fixed) in pips.
- Open Buysell – Allow BuySell?
- Open Sellbuy – Allow SellBuy?
- Max order for buysell – Max allowed BuySell orders
- Max order for sellbuy – Max allowed SellBuy orders
![]()
Category <Trading range>
This category determines the trading zone on TDP graph (You can see TDP graph from Indicator “True Different Pair”). In below figure the red graph is TDP graph we determine trading zone between 2 horizontal line. That is, Min position = -430.8, Max position = -266.1
![]()
-
Max position – Max position allowed opening order (In this case is -266.1). This will work when choose above (Use trading range) = true.
-
Min position – Min position allowed opening order (In this case is -430.8). This will work when choose above (Use trading range) = true.
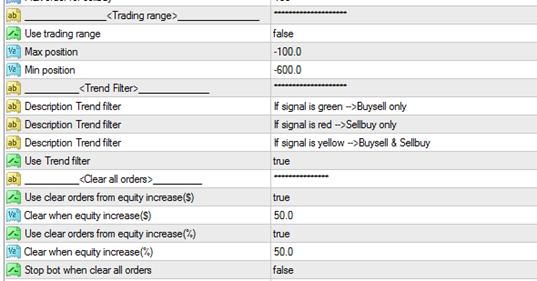
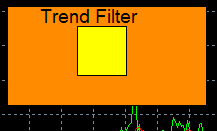
Category<Trend filter>
![]()
This function will filter the trend of TDP graph. When TDP graph has a tendency to strong downward trend , EA will place only
SellBuy and display in red color. If TDP graph has a tendency to strong upward trend , EA will place only BuySell and display in
green color. In other case (Sideway) EA can place both BuySell and SellBuy and display in yellow color.
-

Comments are closed.