USD/MXN at brisk of plunging below 18.0000, US ISM Services PMI eyed
- USD/MXN plunges to multi-year lows around $18.01, despite Banxico’s cutting growth in Mexico.
- An upbeat US ISM Non-Manufacturing PMI could trigger a recovery in the USD/MXN; otherwise, a fall below $18.00 is on the cards.
- USD/MXN Price Analysis: Bad US economy data could trigger a break below $18.00
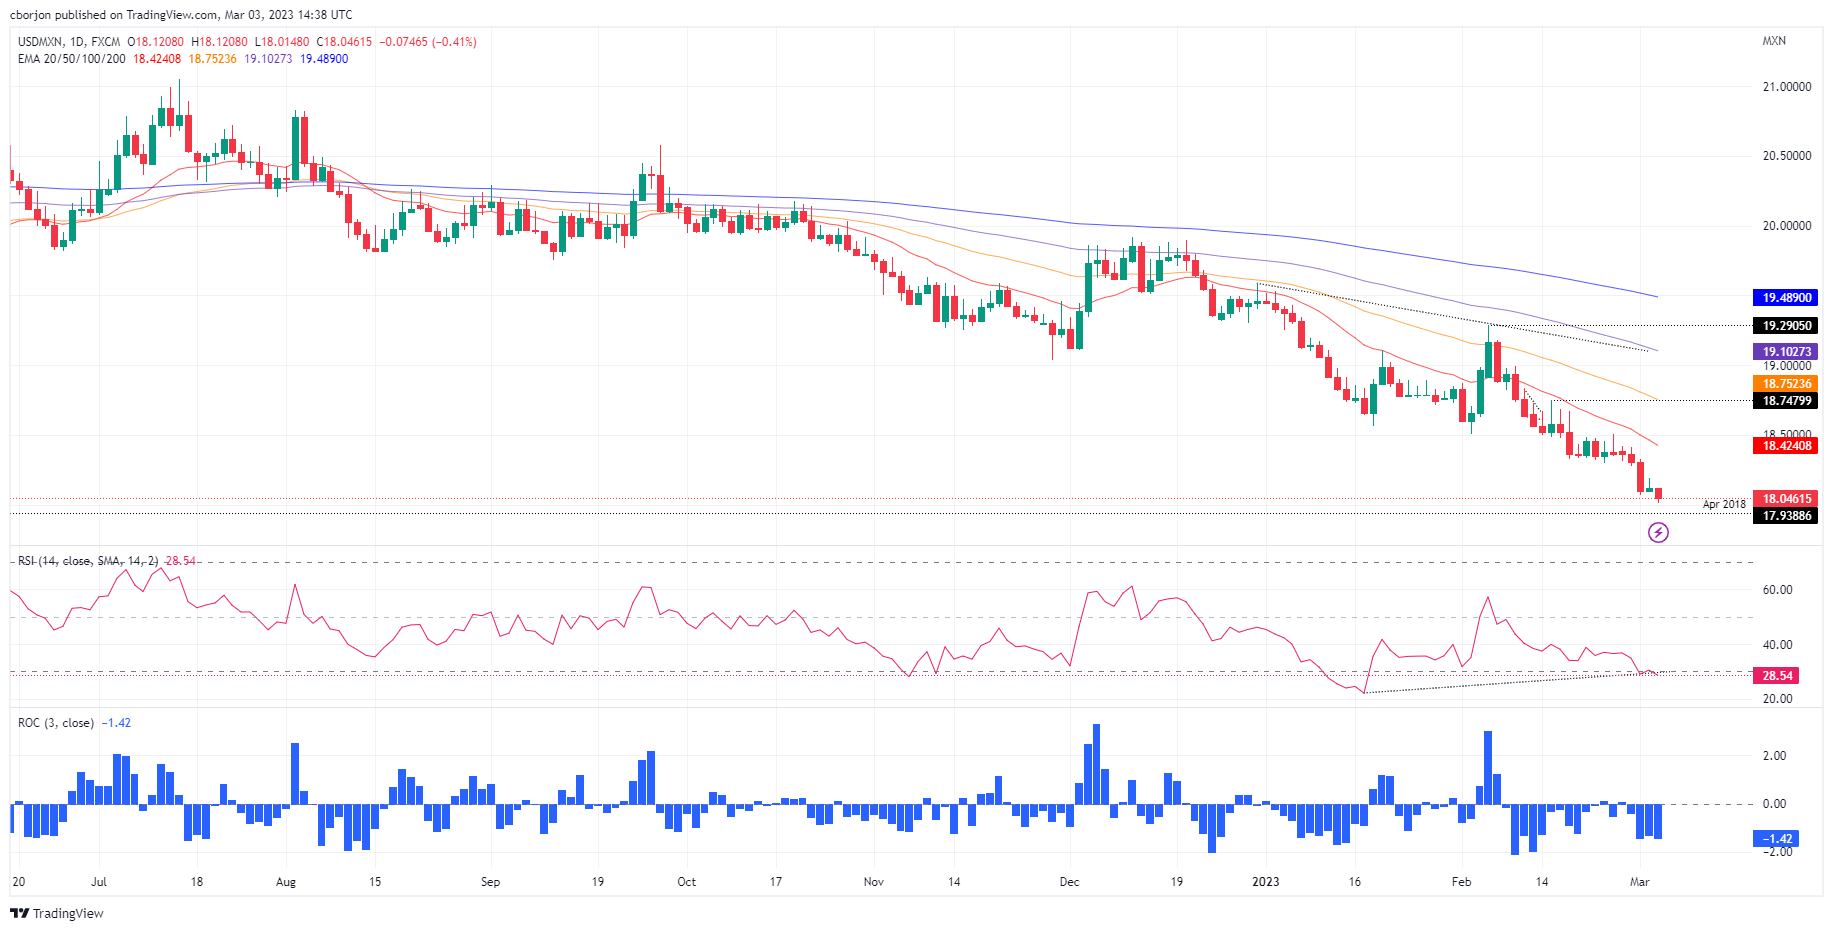
The Mexican Peso (MXN) appreciates against the US Dollar (USD), as the USD/MXN falls to multi-year lows last seen in April 2018 at 18.0148, despite Banxico (Mexican Central Bank) cutting the growth forecast for Mexico in 2023 and 2024. At the time of writing, the USD/MXN exchanges hand at 18.0479, with losses of 0.39%.
USD/MXN falls to 5-year lows at $18.01, US ISM Services PMI eyed
Wall Street is set for a higher open. Global S&P Services and Composite PMIs improved globally, a sign that the worldwide economy is in better shape than foreseen, as traders moved to riskier assets as bond yields eased. A measure of the greenback, the US Dollar Index, drops 0.25% to 104.657.
On Wednesday, Banxico revealed that Mexico’s economy in 2023 and 2024 would grow at a slower pace than initially expected, blamed on the deterioration of US expectations, namely in the industrial sector, according to an inflation report. Banxico forecasts economic growth of 1.6% for Mexico in 2023, lower than the 1.8% estimated, while for 2024, the projection is reduced to 1.8% from 2.1%.
At around 15:00 GMT, the Institute for Supply Management (ISM) would reveal the Non-Manufacturing PMI for February, expected to come at 54.5, below January’s 55.2. Due to high inflationary readings in the United States (US), the prices subcomponent would be closely monitored by investors, with the ISM Prices Paid Index expected to rise to drop from 67.8 in January to 64.5 in February.
An upbeat US ISM Non-Manufacturing report could trigger flows to the US Dollar, which means the USD/MXN could rise from YTD lows. In addition, speculations that Banxico is near pausing its tightening cycle would reduce the interest rate differentials between the US and Mexico. Also, sentiment deterioration would play an important piece of the puzzle in the future of the USD/MXN pair.
Also read: When is the US ISM Services PMI, and how could it affect EUR/USD?
USD/MXN Technical analysis
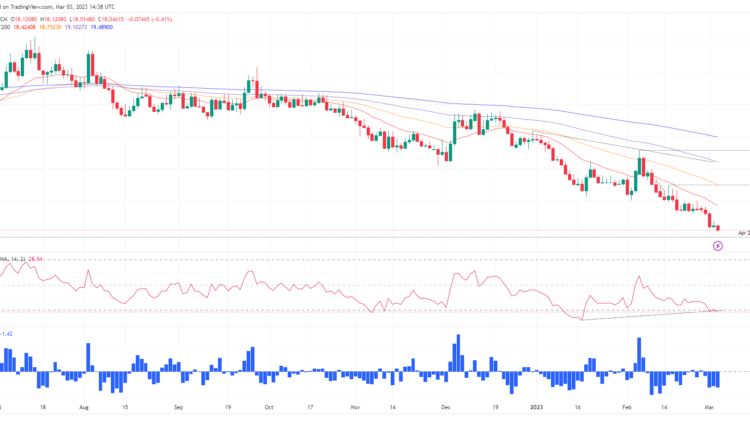
The USD/MXN daily chart portrays the pair as downward biased. After the USD/MXN pair consolidated around $18.30, Wednesday’s fall opened the door to test the 18.0000 psychological barriers. A breach of the latter will expose April’s 2018 swing low at 17.9388, followed by July’s 2017 lows of 17.4498. On the other hand, if the USD/MXN recovers above 18.1930, March’s 2 high, that would open the door to test the MTD high at 18.3296.
USD/MXN Technical levels


Comments are closed.