USD/JPY Probes 135 as BOJ Implements YCC
USD/JPY ANALYSIS & TALKING POINTS
- BOJ bond buying and loans dominate Japanese headlines.
- How much impact will the FOMC minutes have?
- Technical analysis indicates possible downside to come via the rising wedge chart pattern.
Recommended by Warren Venketas
Get Your Free JPY Forecast
JAPANESE YEN FUNDAMENTAL BACKDROP
The Japanese Yen found some support this Wednesday morning against the US dollar while the Bank of Japan (BOJ) had to purchase 10-year government bonds due to the yield breaching the BOJ’s upper limit (0.5%) of their policy band. This has been the second consecutive trading session where this has taken place and has brought into question the BOJ’s ultra-loose monetary policy stance once more.
Trade Smarter – Sign up for the DailyFX Newsletter
Receive timely and compelling market commentary from the DailyFX team
Subscribe to Newsletter
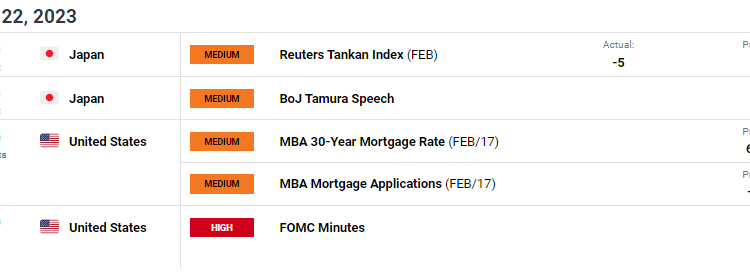
Earlier this morning, the Reuters Tankan Index for February (see economic calendar below) improved slightly from the January read; however, the negative print does suggest worsening conditions within the manufacturing sector. The BOJ’s Tamura followed up with some mixed messaging stating that loose monetary policy is required at present but future policy changes will be vital at some stage in the future. He went on to cite the sustained threat of inflationary pressures in Japan as well as elevated wages as a major contributor from the services sector. The above could provide a hawkish slant to the BOJ’s upcoming meeting leaving room for JPY support.
JPY ECONOMIC CALENDAR
Source: DailyFX economic calendar
From a USD perspective, the highlight for today comes via the FOMC minutes and markets will likely focus on board members who preferred a larger interest rate hike. The greenback may not react extremely favorably considering the recent rally which has shown signs of exhaustion. On another note, geopolitical tensions with US/China and Russia/Ukraine continues to provide sustenance via the USD’s safe-haven appeal.
USD/JPY TECHNICAL ANALYSIS
USD/JPY DAILY CHART

Chart prepared by Warren Venketas, IG
Daily USD/JPY price action continues to trade within the rising wedge chart pattern (black) hovering around the psychological 135.00 handle. Looking at the Relative Strength Index (RSI), there is still room for further upside and a breach above wedge resistance could invalidate the pattern. Bears will be looking for a break and confirmation close below wedge support exposing the 133.63 support level.
Key resistance levels:
- 137.67
- 200-day SMA (blue)
- 135.00
Key support levels:
IG CLIENT SENTIMENT BULLISH
IGCS shows retail traders are currently net short on USD/JPY, with 60% of traders currently holding short positions (as of this writing). At DailyFX we take a contrarian view on sentiment resulting in a short-term upside bias.
Contact and followWarrenon Twitter:@WVenketas


Comments are closed.