

CANADIAN DOLLAR PRICE, CHARTS AND ANALYSIS:
- The Loonie Looks on Course for Further Losses as the Oil Correlation Seems to be Changing.
- Light Data Week on the Calendar with US CPI likely to Dominate.
- Market Participants see 72% chance of no rate at the upcoming BoC Meeting.
Do not forget to Download Your Free Top Trade Opportunities for Q3 from your DailyFX Analysts Below:
Recommended by Zain Vawda
Get Your Free Top Trading Opportunities Forecast
Read More: WTI and Brent Eye a Retracement with Saudi Aramco Reporting Q2 Profits Drop
CANADIAN DOLLAR BACKDROP AND OIL CORRELATION
The Canadian Dollar has struggled of late despite an excellent rally in Oil markets. This obviously comes as a surprise given the relationship and correlation between Oil prices and the Canadian Dollar. It begs the question, is the CAD/OIL correlation dead?
I have been paying close attention to the correlation between the CAD and oil prices for the past few months. Looking at the chart below and we can see that since around May 2021 the usual inverse correlation between USOIL and USDCAD is nonexistent instead we are seeing more of a positive correlation with USDCAD rising as Oil prices do. There have been periods in the past when we have seen similar moves, but it is usually short-lived before reverting back to the norm. However, since May 2021 we seem to be seeing a positively correlated relationship between US Oil and USDCAD something which the most recent rally in Oil prices displayed.
There is a brief period if we look at the chart below (Highlighted in the pink box) where USDCAD rose as Oil Prices declined, now this could have also been in part to US Dollar strength but that is a perfect example of the historic relationship between the two. Either way I am paying particular attention to this to gauge whether the relationship will in time return to its historical norm or is this a permanent shift.
USDCAD vs USOIL (WTI)
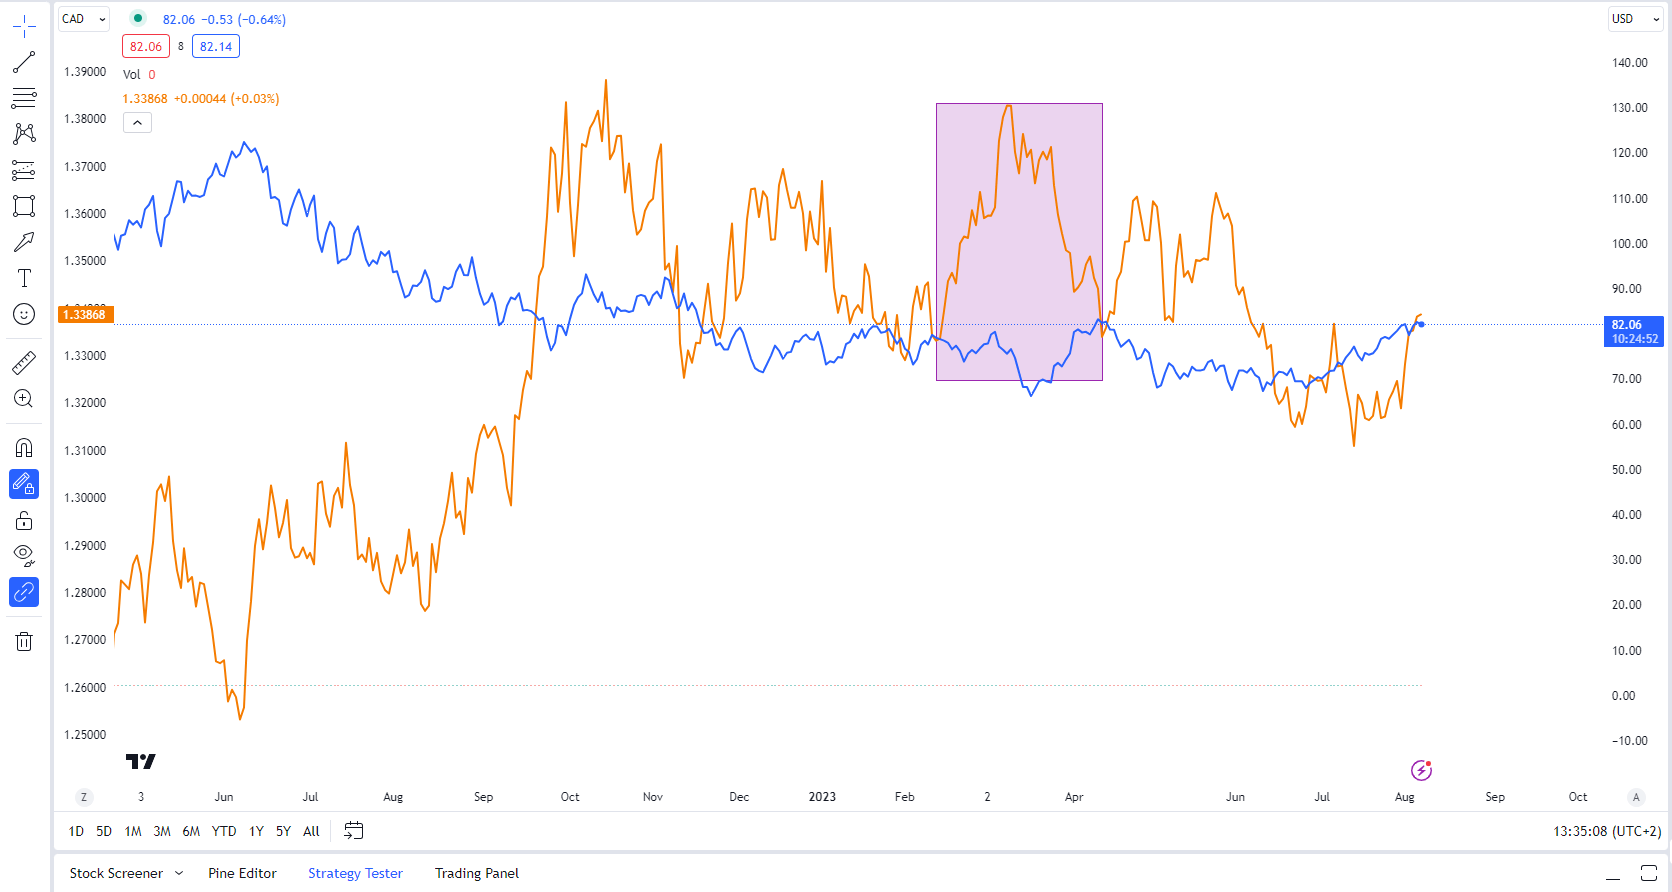
Source: TradingView, Chart Created by Zain Vawda
BANK OF CANADA AND WEEK AHEAD
Now obviously we are in unprecedented times given the speed of interest rate hikes over the past 24 months. This could be a factor as well with regards to the change in relationship between the USDCAD and Oil prices.
The Bank of Canada (BoC) for its part came out swinging at the beginning of the current hiking cycle and it appears market participants believe the BoC is done, and a peak rate has been reached.
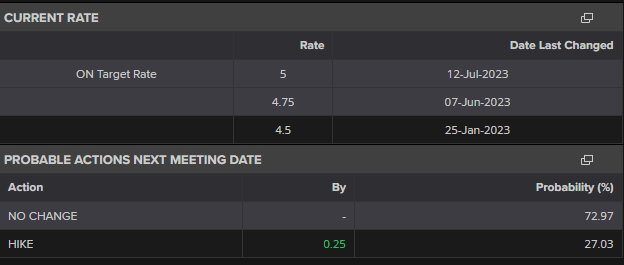
Source: Refinitiv
Looking at the probable actions at the BoC upcoming meeting there is a 72% probabiliy of no change with the Central Bank expected to keep rates steady. This could be working against the CAD as the BoE and potentially the FED may both have another interest rate hike before the year is out.
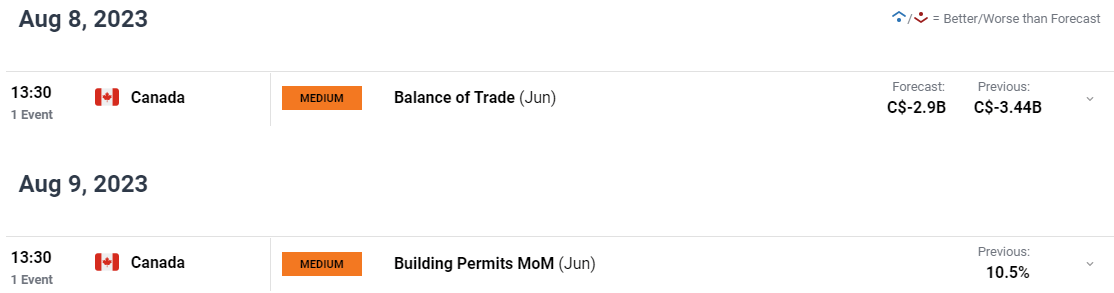
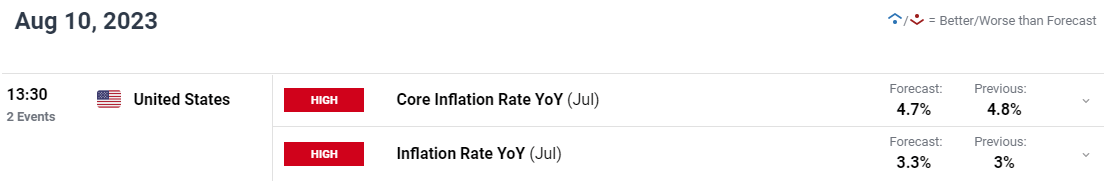
The calendar for the week ahead is rathe bear from a CAD perspective with no high impact risk events. USDCAD could face volatility around the US CPI data release which is once again expected to dominate the week.
For all market-moving economic releases and events, see the DailyFX Calendar
Recommended by Zain Vawda
Traits of Successful Traders
PRICE ACTION AND POTENTIAL SETUPS
USDCAD
USDCAD has continued to grind higher this morning but does appear to be running out of steam heading into the NY open. The pair did gap down ever so slightly over the weekend before running into the 100-day MA which provided resistance on Friday as well. A push higher here faces another hurdle with the 200-day MA resting slightly higher at 1.3450, about 80 pips from current price.
USD/CAD Daily Chart
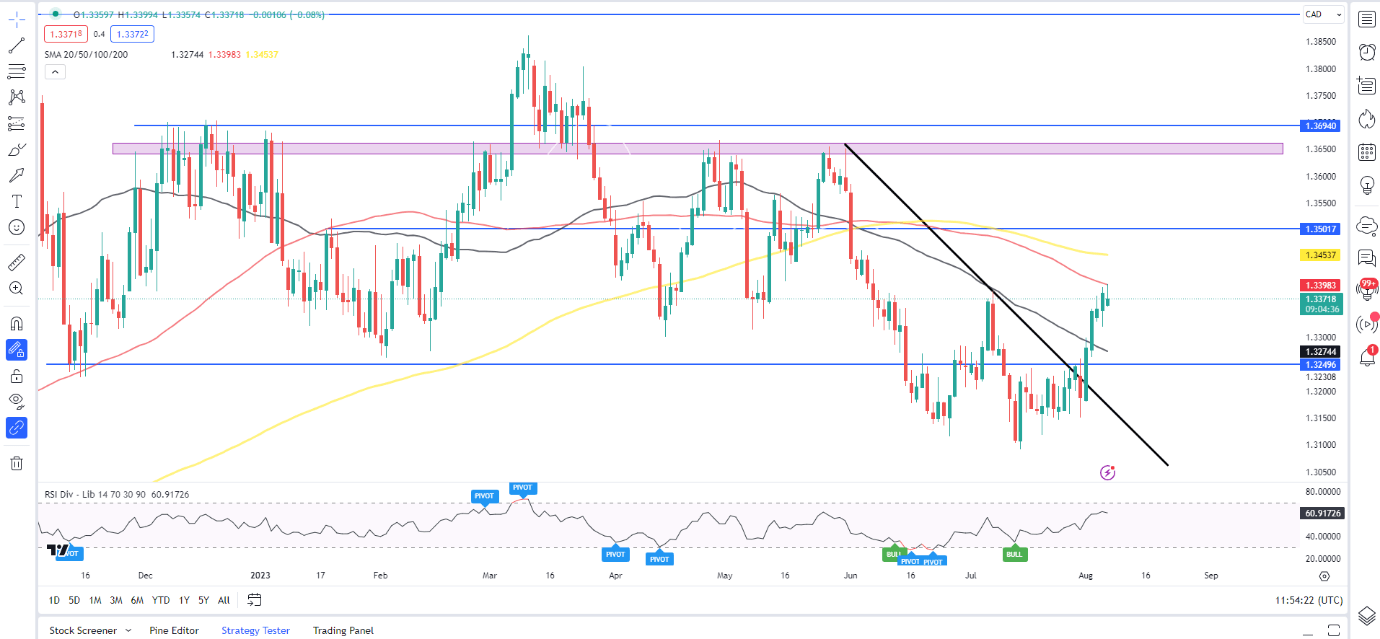
Source: TradingView, prepared by Zain Vawda
A break lower here has the 50-day MA providing support before the swing low around the 1.3150 handle comes into focus. Looking at IG Client Sentiment and 58% of traders are currently short. At DailyFX we typically take a contrarian view to client sentiment suggesting that USDCAD may enjoy a slight pullback before pushing on to print Fresh Highs.
GBPCAD
GBP/CAD Daily Chart
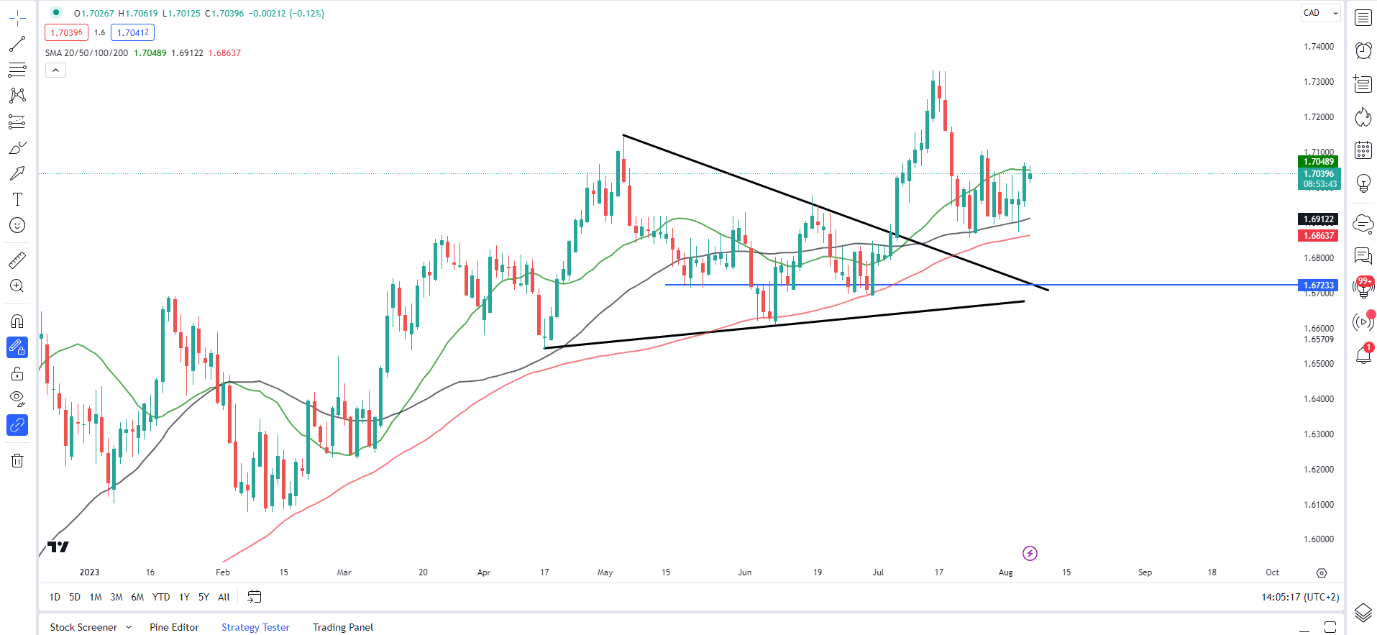
Source: TradingView, prepared by Zain Vawda
From a technical perspective, GBPCAD had broken out of the triangle pattern before putting in a significant rally. The pair has since pulled back finding resistance around the Mas which all rest pretty close to current prices.
Looking at price action and we do appear to be printing higher highs and higher lows and I do expect a continuation of such a move with a break and daily candle close below the 1.6860 mark for a meaningful change of structure to occur and that could help push GBPCAD to fresh highs. Alternatively, a downside breakout could lead to a retest of the descending trendline from early May as well as support around the 1.6800 handle.
Key Intraday Levels to Keep an Eye On:
Support levels:
- 1.6860 (100-day MA)
- 1.6723
- 1.6600
Resistance levels:
- 1.7050 (20-day MA)
- 172.00
- 173.50
Introduction to Technical Analysis
Technical Analysis Chart Patterns
Recommended by Zain Vawda
— Written by Zain Vawda for DailyFX.com
Contact and follow Zain on Twitter: @zvawda
Comments are closed.