USD/CAD at Risk on Hawkish BoC but Fed May Be a Spoiler
USD/CAD TECHNICAL OUTLOOK:
- The Canadian dollar has strengthened significantly against the U.S. dollar since late May
- Bank of Canada’s hawkish stance may reinforce recent FX dynamics
- USD/CAD may head lower if the Fed sticks to the script and doesn’t surprise markets
Recommended by Diego Colman
Get Your Free USD Forecast
Most Read: Silver Prices Draw Support from USD Weakness and Falling Yields, US CPI Eyed
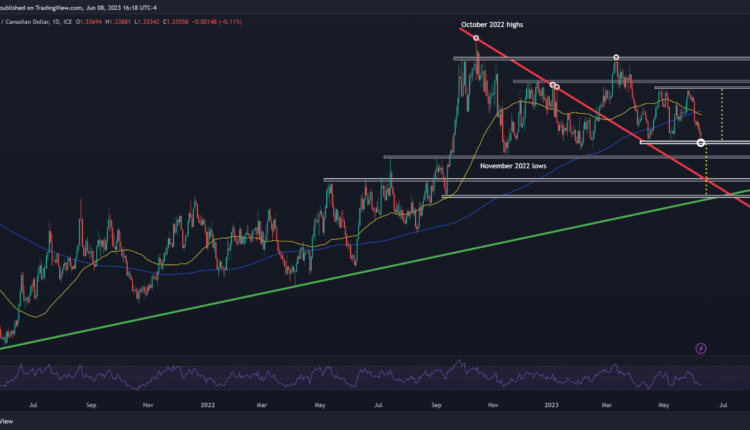
The Canadian dollar has appreciated sharply against the U.S. dollar since late May. The chart below shows how USD/CAD has fallen more than 2.0% over the past two weeks, with the pair now trading near C$1.3350 and steadily approaching its 2023 lows.
Bank of Canada’s surprising decision to raise interest rates at its June meeting after pausing its hiking campaign in January has reinforced recent FX dynamics, acting as another positive driver for the Loonie.
BoC’s aggressive stance could continue to put downward pressure on USD/CAD in the near term, especially if traders boost bets on further tightening in response to the central bank’s view that “monetary policy is not sufficiently restrictive” to bring inflation down to the 2.0% target.
Related: Looming Break in Canadian Dollar After BOC Hike: USD/CAD, EUR/CAD, GBP/CAD Price Setups
The benign outlook for the Canadian dollar, however, hinges on one key factor: the Fed must stick to the script and hold borrowing costs steady next week, in line with Powell’s guidance. If the bank deviates from its telegraphed move, interest rate expectations could quickly shift in a more hawkish direction, sparking a rally in the U.S. dollar.
Although the FOMC does not like to surprise markets, economic circumstances may force policymakers to err on the side of tightening. One possible incoming report that could tip the scales in favor of additional hikes is the May consumer price index survey, which will be released Tuesday.
According to consensus estimates, annual headline CPI fell to 4.1% from 4.9%, and the core gauge eased to 5.3% from 5.5% last month. If inflation results beat these forecasts by a wide margin and show stickiness, the Fed could come out swinging, delivering another 25 basis point hike and projecting a higher peak rate. This would be a bullish outcome for USD/CAD.
| Change in | Longs | Shorts | OI |
| Daily | 6% | -6% | 2% |
| Weekly | 57% | -4% | 33% |
USD/CAD TECHNICAL CHART
In recent months, USD/CAD has been carving out a double top – a bearish technical formation, composed of two similar peaks separated by an intermediate valley, as shown in the daily chart below.
This pattern is confirmed once the price of the underlying completes its “M” shape and breaches the support level created by the neckline, the line that acts as a base for the double top. In the case of USD/CAD, the key floor to watch is 1.3300.
If the double top is validated, USD/CAD could decline sharply, although this scenario may take time to play out. Anyhow, the size of the potential downward slump can be obtained by projecting vertically the height of the pattern from the break point. For the pair, this could mean pullback toward 1.2960.
USD/CAD TECHNICAL CHART
USD/CAD Chart Prepared Using TradingView


Comments are closed.