US Dollar Price Setup Ahead of PCE Data: EUR/USD, USD/JPY, AUD/USD
US Dollar Vs Euro, Japanese Yen, Australian Dollar – Price Setups:
- The US dollar is maintaining a soft tone ahead of US GDP and PCE data.
- While the trend varies across currency pairs, the broader trend continues to be down for USD.
- What is the outlook for EUR/USD, USD/JPY, and AUD/USD?
Recommended by Manish Jaradi
How to Trade the “One Glance” Indicator, Ichimoku
The US dollar is broadly maintaining a weak tone going into key data this week, including GDP and a gauge of inflation, on rising expectations of rate cuts by the US Federal Reserve later this year.
US economic growth likely slowed to 2.0% on-quarter in the January-March quarter from 2.6% in the previous quarter as the impact of interest rate hikes spills over to the broader economy. Price pressures likely eased in March – Core PCE price index rose 4.5% on-year from 4.6% in February. Core measures, including CPI and PPI, appear to be in a cooling phase, but not enough for the Fed to proceed with one more rate hike at next week’s meeting. Beyond that, the market is pricing roughly 50 basis points of rate cuts by the end of the year.
EUR/USD Daily Chart
Chart Created by Manish Jaradi Using TradingView
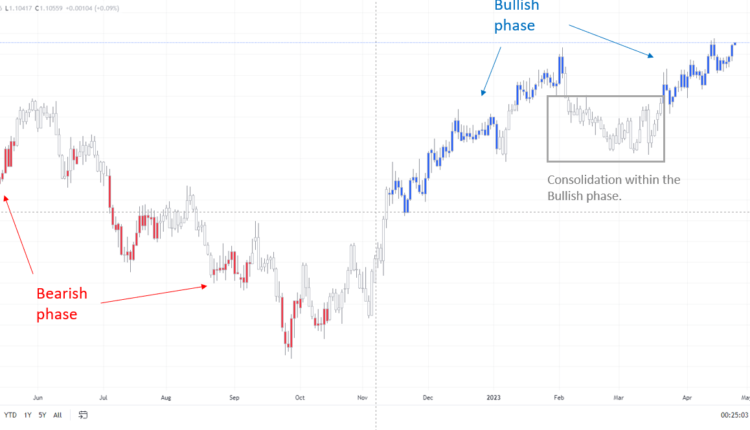
Note: In the above colour-coded chart, Blue candles represent a Bullish phase. Red candles represent a Bearish phase. Grey candles serve as Consolidation phases (within a Bullish or a Bearish phase), but sometimes they tend to form at the end of a trend. Note: Candle colors are not predictive – they merely state what the current trend is. Indeed, the candle color can change in the next bar. False patterns can occur around the 200-period moving average, or around a support/resistance and/or in sideways/choppy market. The author does not guarantee the accuracy of the information. Past performance is not indicative of future performance. Users of the information do so at their own risk.
If data shows price pressures failed to ease last month, it could buy some more time for the US dollar, but won’t be enough to derail the downtrend. Furthermore, key macro data elsewhere could help set the tone for the US dollar, including Australia Q1 inflation and Germany GfK consumer confidence data due Wednesday, and BOJ interest rate decision and Euro area Q1 GDP due Friday.
EUR/USD Daily Chart

Chart Created by Manish Jaradi Using TradingView
EUR: Attempting to break above key resistance at 1.10
On technical charts, EUR/USD’s trend remains up on the daily charts, as the colour-coded candlestick charts based on trending/momentum indicators show. See previous updateson April 10andApril 13highlighting the uptrend. The pair is now preparing to break above a vital ceiling at the February high of 1.1035. A decisive break above could pave the way toward 1.1700 — the price objective of the double bottom pattern (the January and March lows).
AUD/USD Daily Chart
Chart Created by Manish Jaradi Using TradingView
AUD/USD: Capped by resistance
While AUD/USD has this month held above quite a strong support at the late-March low of 0.6625, the upward momentum subsequently has been lacking, leaving it vulnerable to another leg lower. So far, AUD/USD has been capped under a tough ceiling around the 200-day moving average, roughly coinciding with the early-April high of 0.6795. Unless the pair is able to cross the hurdle, the path of least resistance would remain sideways to down. On the downside, immediate support is at 0.6625, followed by a stronger cushion at the March low of 0.6550.
USD/JPY 240-minute Chart

Chart Created by Manish Jaradi Using TradingView
USD/JPY: Looking for cues from BOJ and US data
USD/JPY’s minor rebound since March appears to have stalled at a key converged barrier: the 89-day moving average, coinciding with the upper edge of a rising channel from March, and the upper edge of the Ichimoku cloud on the daily charts. The upward pressure is unlikely to run out of steam while the pair holds above the immediate floor on a horizontal trendline from earlier this month at about 134.00. Any break below could expose the downside toward 132.00.
USD/JPY Daily Chart
Chart Created by Manish Jaradi Using TradingView
Trade Smarter – Sign up for the DailyFX Newsletter
Receive timely and compelling market commentary from the DailyFX team
Subscribe to Newsletter
— Written by Manish Jaradi, Strategist for DailyFX.com
— Contact and follow Jaradi on Twitter: @JaradiManish


Comments are closed.