US Dollar in the Crosshairs as BoJ Tilts Post ECB and Fed Decisions. Lower USD/JPY?
US Dollar, USD/JPY, Japanese Yen, BoJ, Fed ECB, AUD/USD, RBA – Talking Points
- The US Dollar resumed strengthening today with volatility ticking higher
- The Bank of Japan let the word out early of an adjustment, then delivered
- Markets are now reassessing the path of global central bank tightening
Recommended by Daniel McCarthy
Get Your Free USD Forecast
The US Dollar steadied against most currencies today except for the Japanese Yen. The Bank of Japan (BoJ) cajoled the market toward higher yields in the backend of the Japanese Government Bond (JGB) market.
DailyFX Strategist Tetsuya Kimata, based in Tokyo, made these observations.
“I think the BOJ has shown a dovish stance even though the Bank adjusted Yield Curve Control (YCC). In their inflation forecast, they revised the 2023 CPI forecast to 2.5% from 1.8%.
They also revised down their 2024 forecast to 1.9% from 2.0% but kept its 2025 forecast to 1.6%. This would indicate that the BOJ would like to continue monetary easing. The market has reacted with JPY appreciation and a sharp drop in NKY.
I think this market reaction would be temporal.”
A deeper dive into the BoJ announcement can be read here. Their decision comes on top of the Fed and the ECB tightening policy in the last 2 days.
While the Yen has been the biggest currency gainer today, the Aussie Dollar has been undermined by PPI and retail sales missing estimates.
In general, markets are recalibrating going into the weekend after an action-packed week.
Monetary policy is now at a crossroads with the Fed making it clear that future decisions will be data dependent. The previously well telegraphed rate decisions are now consigned to history.
Going forward, major central bank meetings appear likely to be anticipated with a high degree of uncertainty.
Gold is oscillating around US$ 1,950 an ounce while the WTI futures contract is under US$ 80 bbl and the Brent contract is a touch below US$ 84 bbl at the time of going to print.
Looking ahead, after a stack of European CPI data, Canada will see GDP figures for May.
The full economic calendar can be viewed here.
Recommended by Daniel McCarthy
How to Trade USD/JPY
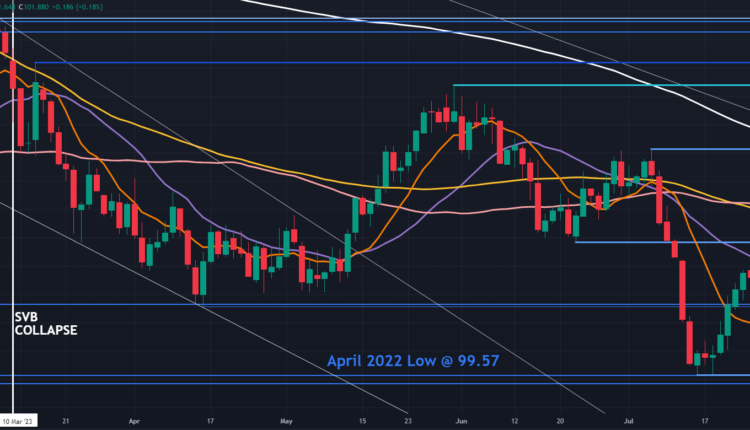
DXY (USD) INDEX TECHNICAL ANALYSIS
The DXY (USD) index made a 2-week high today after a wild range on Thursday.
It has cleared the 10- and 21-day simple moving averages (SMA) and that may indicate short-term bullish momentum could be unfolding.
Near-term resistance might be at the breakpoint of 101.92 ahead of the 55- and 100-day SMAs in the 102.40 – 102.60 area.
Support could be at the breakpoint zone near 100.80 or below at the 15-month low of 99.58 which was just above the April 2022 low of 99.57.
Chart created in TradingView
— Written by Daniel McCarthy, Strategist for DailyFX.com
Please contact Daniel via @DanMcCarthyFX on Twitter


Comments are closed.