

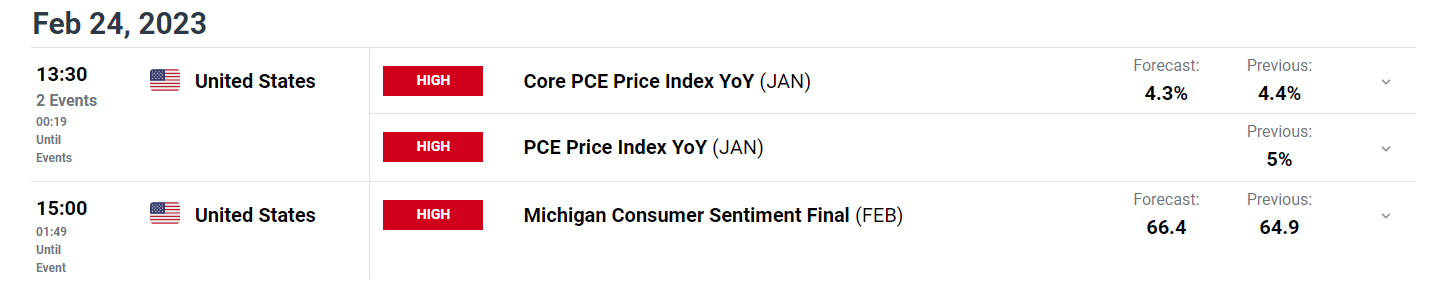
US PCE Inflation
- Core PCE (YoY) 4.7% vs 4.3% expected
- Headline PCE (YoY) 5.4% vs 5% expected
- Immediate market reaction: DXY, S&P 500, Yields (updates pouring in, refresh the article in a few minutes)
Recommended by Richard Snow
Introduction to Forex News Trading
Inflation Reveals its Ugly Head
While it must be said that the market pays more attention to the CPI version of inflation, the Fed looks to the broader PCE measure as an indication of price trends. Inflation has been declining steadily but a number of different inflation measures (CPI and PPI notable) have shown a bit of a resurgence in price pressures, printing higher than expected, but still maintaining the disinflationary trend.
Customize and filter live economic data via our DailyFX economic calendar
Today’s PCE print serves to confirm the Fed’s message that the fight against inflation is not over and that the terminal rate for interest rates appears headed for 5.5%.
Warmer weather in January and the biggest rise in social security payments helped reinvigorate consumer spending in January after a dismal December print. It appears that the increased discretionary income has contributed to a rise in the general price if goods and services in the US economy. Something the Fed remains motivated to rectify.
USD
The dollar (DXY) rose on the back of the hotter PCE print as Fed fund futures and US yields (2 and 10 year treasuries) all rose.
DXY 5 min chart
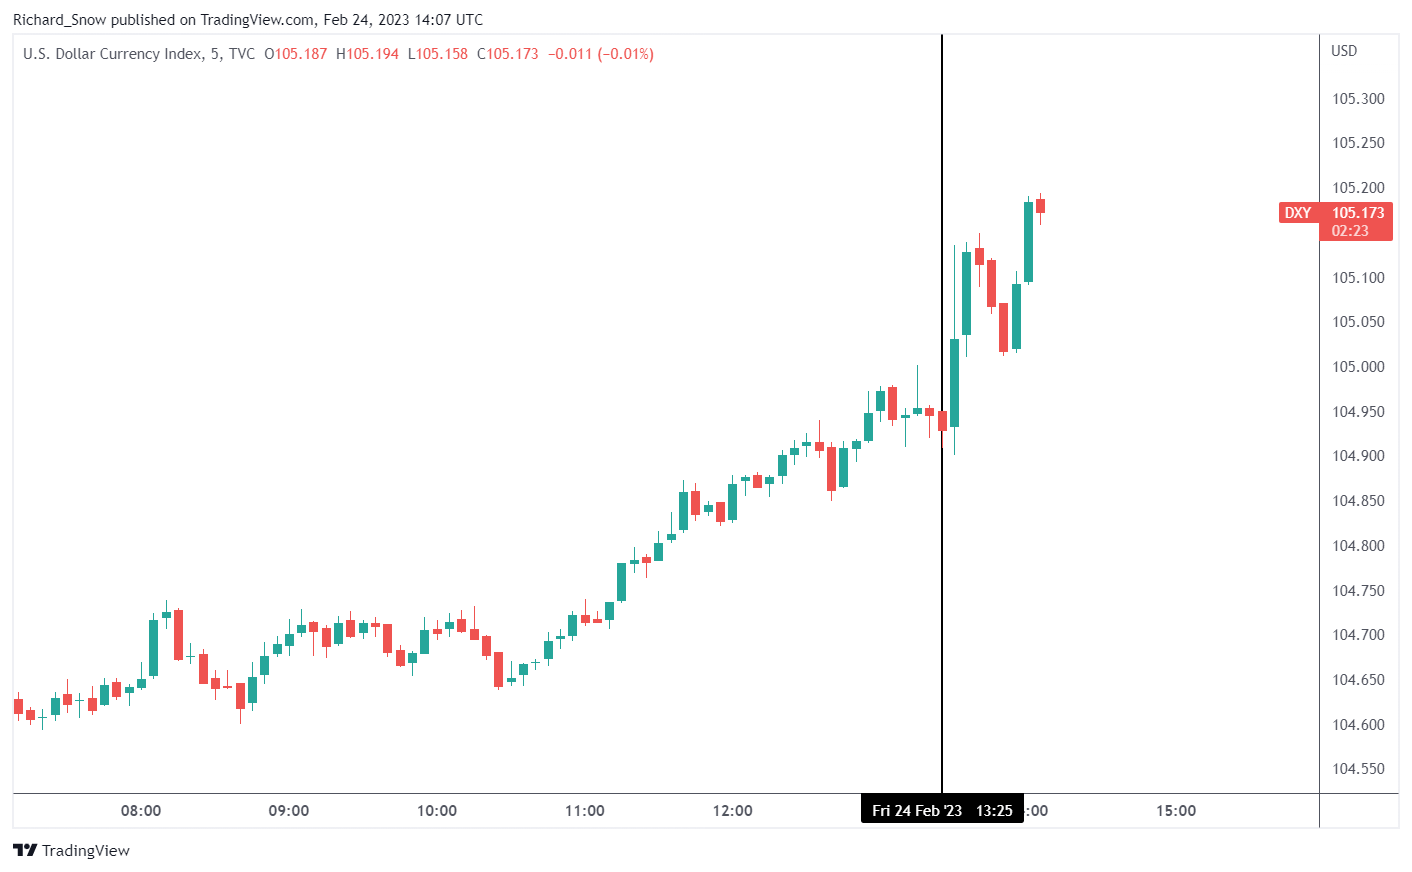
source: tradingview
S&P 500 Futures
The E-Mini Futures (S&P 500) continued the bearish momentum ahead of the announcement as a rise on geopolitical tensions and rising rate hike expectations have seen a more cautious approach from investors lately. 4000 remains a key indication of a bearish continuation with a daily close below 4000 supporting the recent decline.
S&P 500 E-Mini Futures 5 min chart
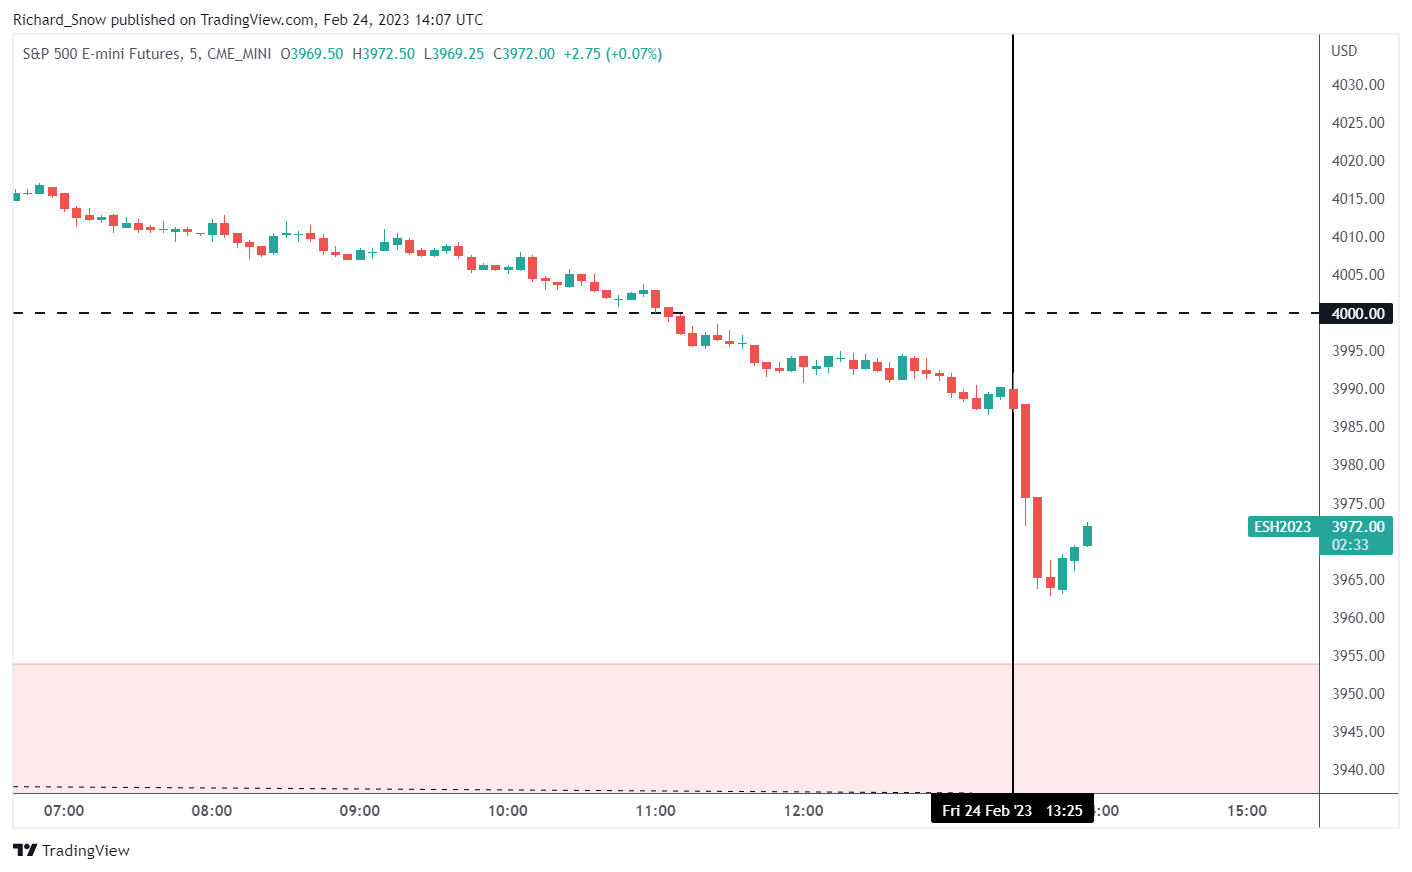
source: tradingview
2-year Treasury Yield
The 2-year treasury yield is often associated with Fed interest rate policy as it is generally seen as a medium term time frame – the rough time frame the Fed uses when deliberating on appropriate policy actions. Bonds sold off after the announcement, leading to another leg higher in the yield.
2-year treasury yield 5 min chart
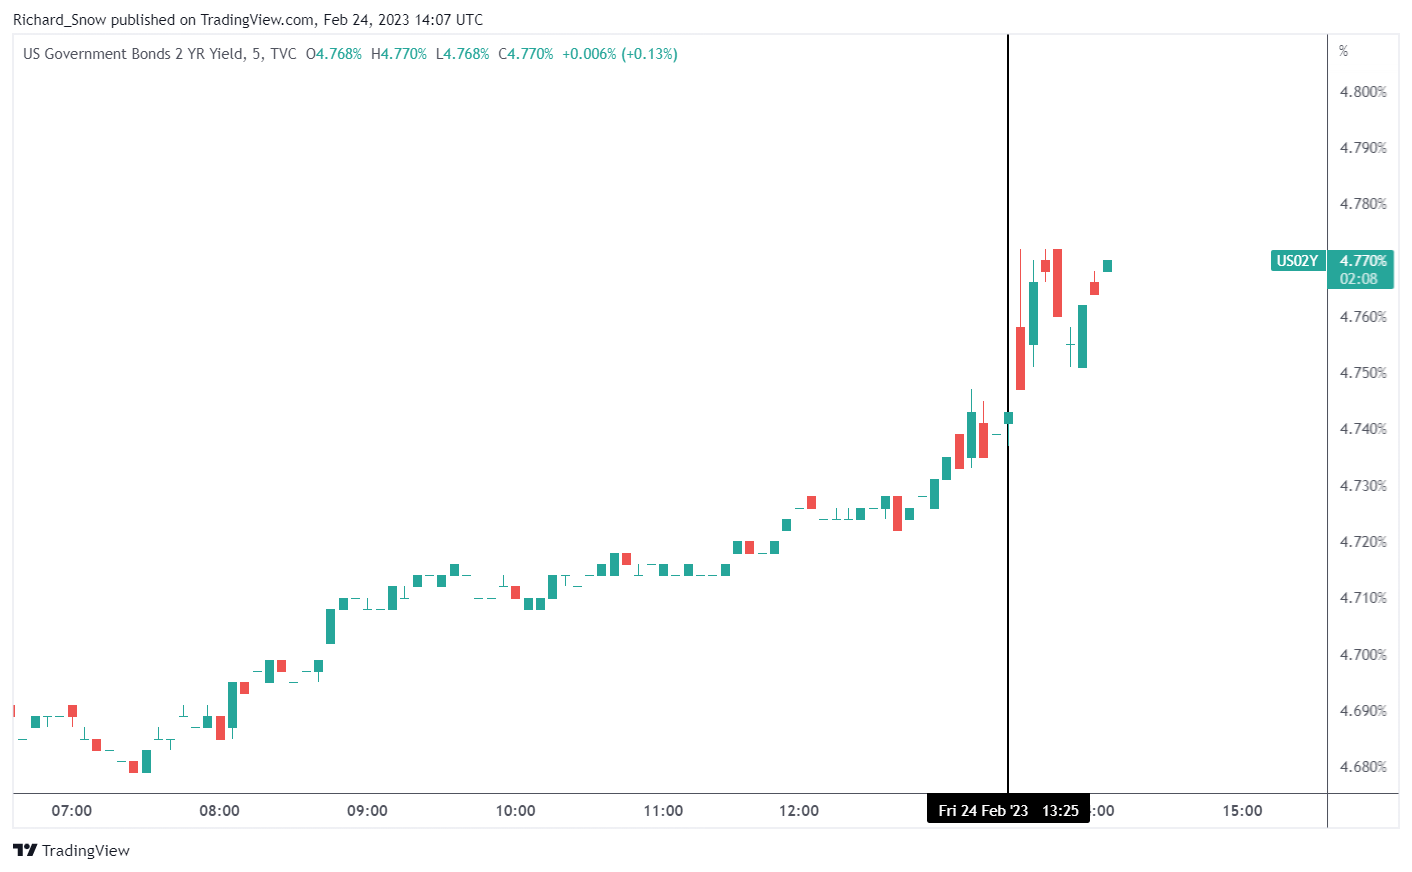
source: tradingview
Recommended by Richard Snow
Learn the #1 mistake traders make and avoid it
USD/JPY
USD/JPY has been in focus recently as expectations of a more hawkish direction at the Bank of Japan fades. The man touted to be the new BoJ head Kazuo Ueda this morning stated that low rates remain appropriate, leaving the door open for another move higher in the pair.
USD/JPY 5 min chart
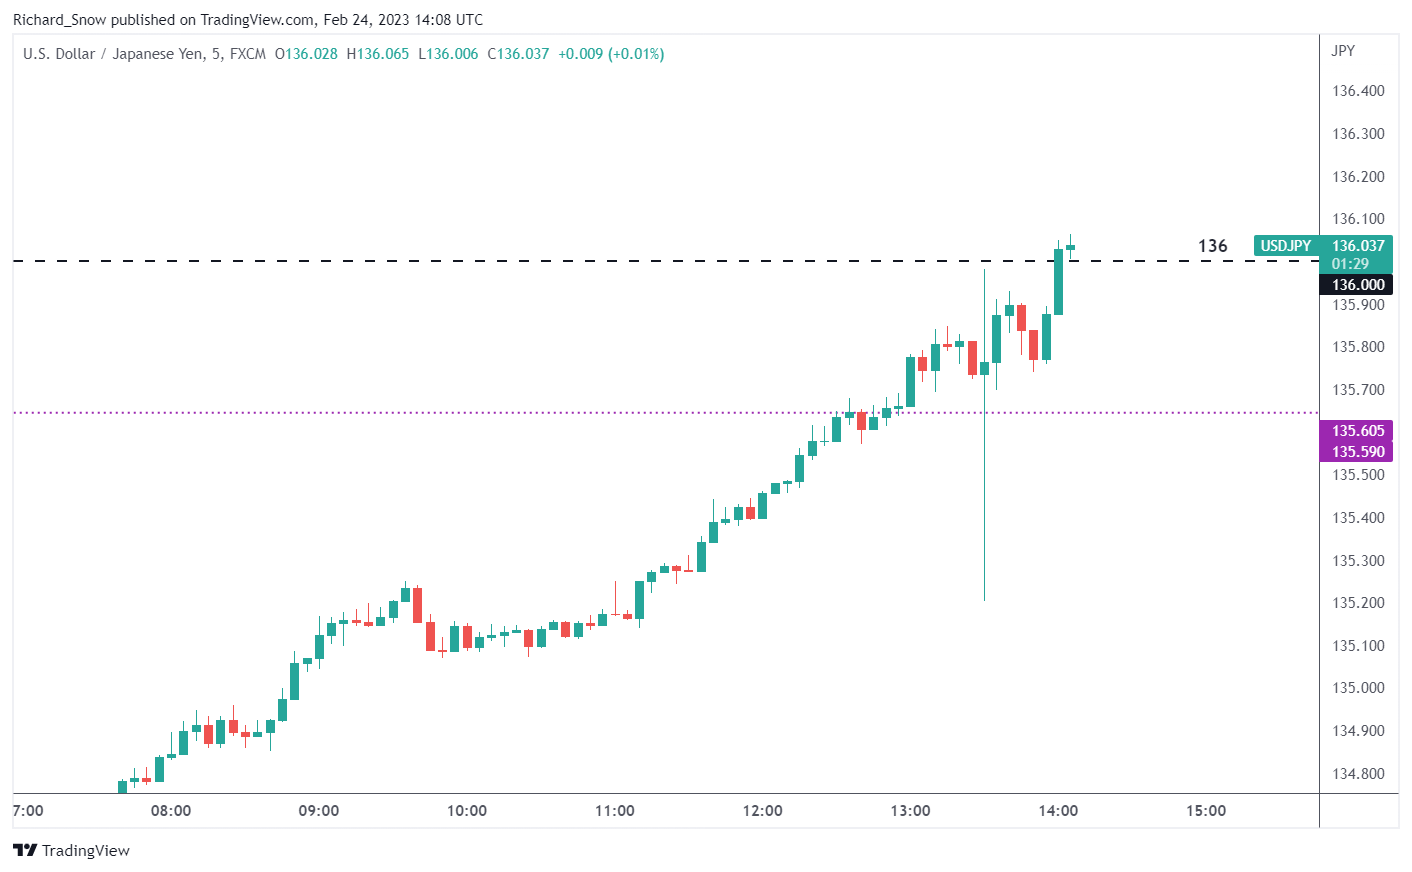
source: tradingview
— Written by Richard Snow for DailyFX.com
Contact and follow Richard on Twitter: @RichardSnowFX
Comments are closed.