The XAU/USD advance was held down by strong US ISM PMIs
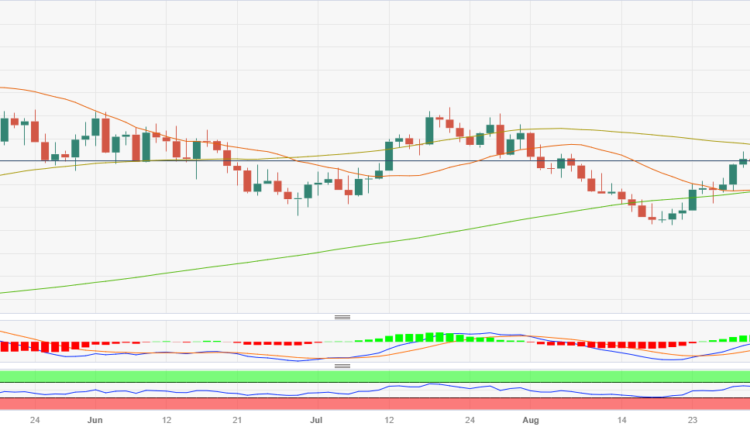
- XAU/USD rose to a daily high of $1,952 and then got rejected by 100-day SMA, retreating to $1,940.
- US yields initially dropped after mixed US NPFs but recovered after strong US ISMs from August.
At the end of the week, the Gold spot price XAU/USD erased daily gains, retreating towards the $1,940 area. After initially retreating, the US yields recovered during the American session, but still the yellow metal will set a winning week of more than 1%.
The highly anticipated US Nonfarm Payrolls report from August showed mixed figures. On a positive note the headline’s NFPs rose to 187,000, higher than the 170,000 expected and the previous 157,000. Average Hourly Earnings came in soft, increasing by 0.2% MoM vs. the 0.3% expected. Unemployment rose to 3.8% in the same month, against all forecasts.
Regarding economic activity, the Institute for Supply Management (ISM) Manufacturing PMI figures from the United States came in above the consensus in August, with the actual figure coming in at 47.6, higher than the expected figure of 47 from the previous 46.4.
The US bond yields, often seen as the opportunity cost of holding gold, were volatile following the employment and economic activity figures. The 2-year yield dropped to a three-week low around the 4.76% area, settling at 4.85%. Likewise, the 5 and 10-year yields dropped to their lowest level since August 10 and settled at 4.27% and 4.15%, respectively. Regarding the next Federal Reserve (Fed) expectations, markets lowered their bets for an additional hike in 2023. According to the CME FedWatch tool, investors are still confident that the Fed won’t hike in the September meeting, and the odds of a hike in November and December dropped to nearly 35%
XAU/USD Levels to watch
According to the daily chart, the technical outlook for XAU/USD leans neutral to bearish as signs of bullish exhaustion emerge. The Relative Strength Index (RSI) displays a negative slope above its midline, and the Moving Average Convergence Divergence (MACD) shows fading green bars. With a downward trend below its midline, the Relative Strength Index (RSI) suggests a bearish sentiment, while the Moving Average Convergence (MACD) displays weaker green bars. On the other hand, the pair is below the 100-day Simple Moving Averages (SMAs) but above the 20 and 200-day averages, suggesting that the buyers may still have some gas left in the tank.
Support levels: $1,930, $1,915 (20 and 200-day SMA convergence), $1,900.
Resistance levels: $1,950 (100-day SMA), $1,970, $2,000.
XAU/USD Daily Chart
-638291889766968784.png)


Comments are closed.