Technical Levels Support Tight Range
CRUDE OIL (WTI AND UK OIL) Analysis
Recommended by Tammy Da Costa
How to Trade Oil
Crude oil has continued to be shaken from the effects of a stronger US Dollar and higher inventories that rattled markets last week. With both UK (Brent) crude and WTI (US oil) failing to make any distinctive moves, historical technical levels have provided support and resistance for price action.
As the DXY (US Dollar index) eased back from a seven-week high, recession fears and a weaker global outlook limited offset supply concerns in Poland.
Visit the DailyFX Educational Center to discover why news events are Key to Forex Fundamental Analysis
This follows an announcement over the weekend stating that Russia has halted its supply of oil to Poland. While the conflict in Ukraine remains a key catalyst for oil supply, the recent EIA inventories report showed an increase in oil inventories, contributing to the recent.
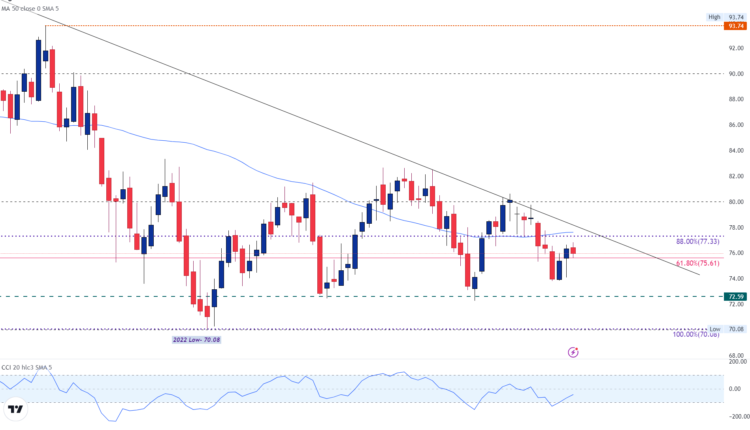
After opening above the 61.8% Fibonacci of the 2008 – 2020 move at 75.61, WTI made a slight recovery before peaking at a high of 76.82.
With the 50-day moving average forming an additional barrier of resistance, bears have been offered the opportunity to continue to drive futures lower.
WTI (CL1) Daily Chart
Chart prepared by Tammy Da Costa using TradingView
US WTI Crude – Key Levels
| Support | Resistance |
|---|---|
| 75.61 (88% Fibonacci 2008 high – 2020 low) | 77.33 (88% retracement 2022 move)) |
| 72.59 (Historical support) | 77.6 (50-day MA) |
| 70.08 (2022 low) | 80 (Psychological level) |
Trade Smarter – Sign up for the DailyFX Newsletter
Receive timely and compelling market commentary from the DailyFX team
Subscribe to Newsletter
UK Oil (Brent) Price Action
UK crude oil (Brent) currently trading at the mid-point of the 2008 (high) – 2020 (low) move, which has yet to be violated. With lackluster momentum driving prices into a narrow range, pressure is building within the confines of a symmetrical triangle.
As bulls aim to gain traction above the 50-day moving average up ahead, the CCI (commodity channel index) has returned to the (acceptable range), after briefly testing oversold territory last week.
Brent Crude (UK Oil) Daily Chart

Chart prepared by Tammy Da Costa using TradingView
| Support | Resistance |
|---|---|
| 81.77 (mid-point of the 2008 – 2020 move) | 82.00 (Psychological level) |
| 80.00 (Psychological level) | 83.44 (50-day MA) |
| 75.11 (December ’22 low) | 86.86 (Monthly high) |
Recommended by Tammy Da Costa
Improve your trading with IG Client Sentiment Data
— Written by Tammy Da Costa, Analyst for DailyFX.com
Contact and follow Tammy on Twitter: @Tams707


Comments are closed.