

S&P 500: Current dynamics and immediate prospects – Analytics & Forecasts – 3 July 2023
Despite expectations of two more interest rate hikes by the Fed, the major US stock indexes ended the past month, quarter, and the first half of the year on a positive wave.
Expectations of a further increase in the cost of borrowing from the Fed remain, which fuels the positive dynamics of the dollar. However, this also does not prevent the US stock market from growing, which received support from the positive macro statistics received in June and last week.
Economists believe that the US economy is protected from the risk of a recession by several mechanisms (active job creation, high corporate profitability, lower US household savings rates, government programs to support investment and energy transition).
Speaking about the possibility of 2 more interest rate hikes this year, the head of the Fed, Powell, made a reservation that the final decision regarding the July meeting has not yet been made. “We don't want to overdo it,” Powell said, and “will continue to make decisions from meeting to meeting based on incoming data, their implications for the outlook and the balance of risk.”
Investors were also encouraged by the results of the Fed's stress test on the banking system last week. They showed that almost all major US banks are able to withstand a serious recession in the economy with current reserves of monetary liquidity, and in the event of theoretically possible new emergency situations and shocks, mechanisms for operational support from the Fed have already been developed.
In other words, so far there are more reasons for further growth of US stock indices than for their decline.
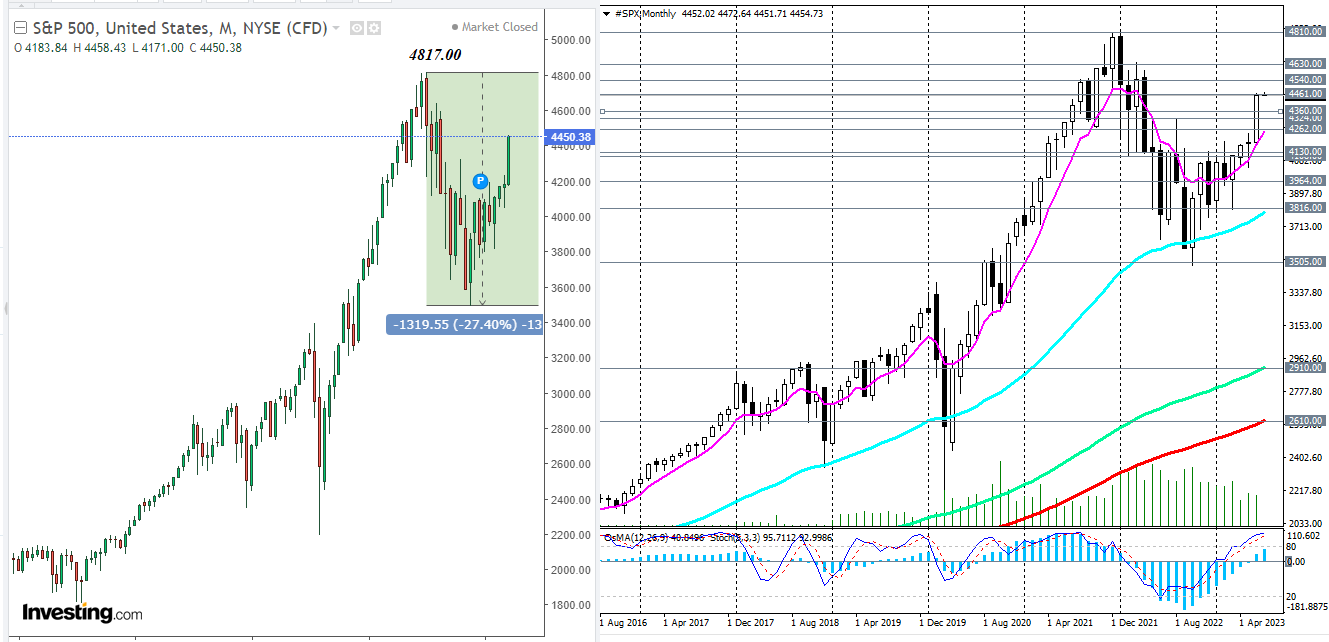
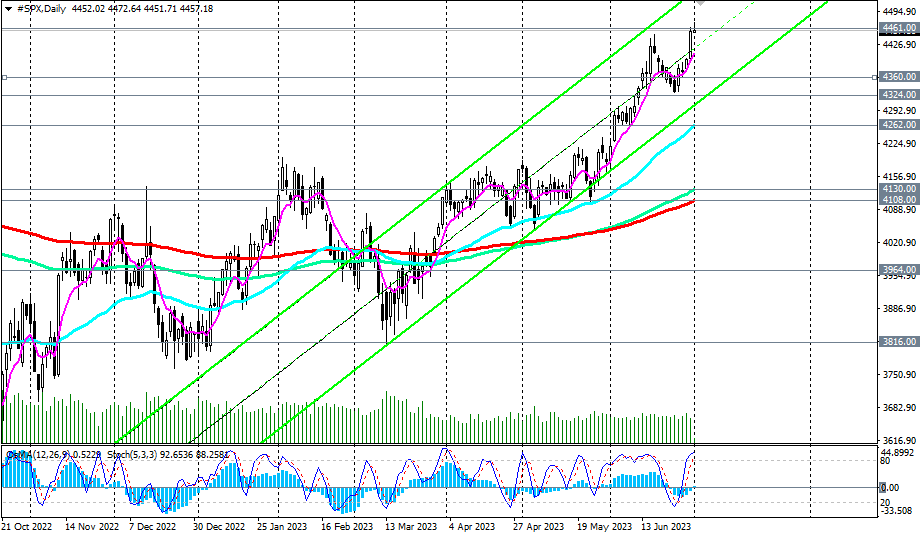
From a technical point of view, the S&P500 index is developing an upward trend within the global bull market, being significantly above the support levels of 2910.00, 2610.00, separating the global bull market from the bear market. Confirmed breakdown of the June high at 4461.00 may be a signal to open new long positions.
The most “fast” signal for opening short positions (within the correction) may be a breakdown of the short-term support level of 4409.00. In the medium term, a correction is possible up to the support level of 4262.00, and a consistent breakdown of the support levels of 4400.00, 4360.00, 4324.00 will confirm our assumption.
Support levels: 4409.00, 4360.00, 4324.00, 4262.00, 4130.00, 4108.00, 3964.00, 3816.00, 3505.00
Resistance levels: 4461.00, 4540.00, 4630.00, 4810.00
Comments are closed.