Retreat in US Yields Supports Gold, But for How Long? XAU/USD, XAU/EUR Price Setups
Gold, XAU/USD, XAU/EUR – Price Action:
- XAU/USD is holding above crucial support, thanks to the retreat in US Treasury yields.
- XAU/EUR has struggled at key resistance area.
- What is the outlook and key levels to watch in XAU/USD and XAU/EUR?
Recommended by Manish Jaradi
How to Trade Gold
Gold rose on Tuesday, tracking the decline in US Treasury yields after a deal in Washington to raise the government’s debt ceiling, potentially averting a catastrophic government default. But is the short-term downtrend in the yellow metal over?
Yields on near-end US Treasury bills fell sharply even as the deal needs to secure blessings from Congress before June 5, when the Treasury Department could run out of funds to pay its debts. A vote on this is expected to occur in the House on Wednesday which gives the Senate time to consider it before June 5.
XAU/USD 240-minute Chart
Chart Created by Manish Jaradi Using TradingView; Notes at the bottom of the page.
However, the upside in gold could be capped by growing odds of another rate hike by the US Federal Reserve at its next meeting. Markets are pricing in a 60% chance of a 25 bps Fed rate hike at the June meeting up from 25% about a week ago, according to the CME FedWatch tool.
XAU/USD Daily Chart

Chart Created by Manish Jaradi Using TradingView; Notes at the bottom of the page.
XAU/USD: Short-term trend remains down
On technical charts, XAU/USD remains within a well-defined downtrend channel since early May on the 240-minute charts, a point reinforced by colour-coded candlestick charts, based on trending / momentum indicators. For the immediate downward pressure to fade, the yellow metal needs to break above the 1985-2000 area (including the 200-period moving average and the late-March high on the 240-minute charts).
XAU/USD Daily Chart
Chart Created by Manish Jaradi Using TradingView
On the daily charts, as the colour-coded candlestick charts show, the trend has moved to a consolidation phase within the overall bullish structure. If history is any guide, consolidations can extend from a few days to a few weeks. So far, gold is holding above quite a strong cushion around 1930, including an uptrend line from the end of 2022, the 89-day moving average, and the lower edge of the Ichimoku cloud on the daily charts. This support is crucial, and any break below could open the door toward the 200-day moving average (now at about 1835).
XAU/USD 240-minute Chart

Chart Created by Manish Jaradi Using TradingView
Beyond the daily charts, in recent months, the momentum on higher timeframe charts has been a concern – see previous updateson March 28,April 16,April 24,May 10, May 17, and the most recent “Is the Downward Correction in Gold Over?”, published May 22.
XAU/EUR Monthly Chart
Chart Created by Manish Jaradi Using TradingView
XAU/EUR: Slowing momentum on higher timeframe charts
Like in the case of XAU/USD, the momentum on higher timeframe charts has slowed even as XAU/EUR has made new highs in recent months. Most recently, gold has failed to cross above the March highs of 1865-1885 against the euro. Any break below an uptrend line from early 2021 (at about 1725) would indicate that the upward pressure had faded in XAU/EUR.
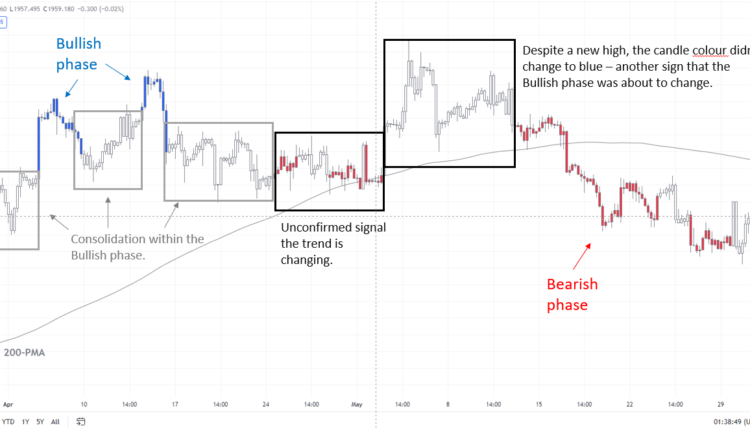
Note: In the above colour-coded charts, Blue candles represent a Bullish phase. Red candles represent a Bearish phase. Grey candles serve as Consolidation phases (within a Bullish or a Bearish phase), but sometimes they tend to form at the end of a trend. Note: Candle colors are not predictive – they merely state what the current trend is. Indeed, the candle color can change in the next bar. False patterns can occur around the 200-period moving average, or around a support/resistance and/or in sideways/choppy market. The author does not guarantee the accuracy of the information. Past performance is not indicative of future performance. Users of the information do so at their own risk.
Recommended by Manish Jaradi
The Fundamentals of Trend Trading
— Written by Manish Jaradi, Strategist for DailyFX.com
— Contact and follow Jaradi on Twitter: @JaradiManish


Comments are closed.