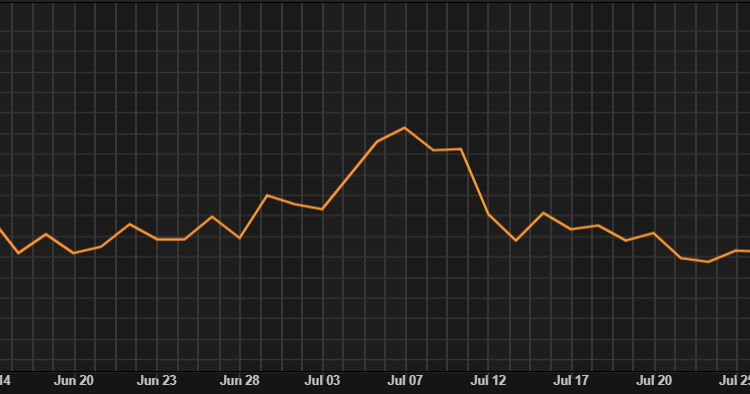
Real Yields Continue to Suppress Gold Prices
GOLD ANALYSIS & TALKING POINTS
- Gold being weighed down by aggressive monetary policy and dwindling inflation.
- Jobless claims data will give further insight into US labor market.
- Falling wedge give bulls hope.
Recommended by Warren Venketas
Get Your Free Gold Forecast
XAU/USD FUNDAMENTAL BACKDROP
Gold prices have been on the backfoot since mid-July as the US dollar gained ascendency. With moderating inflation and an expectation of sustained elevated interest rates by the Fed, real yields have continued to soar (refer to graphic below). Yesterday’s FOMC minutes reiterated a hawkish bias alongside some Fed hawks that have not closed the door to future rate hikes if required. Today’s US Treasury yields have ticked higher once more and the expectation for a ‘higher for longer’ cycle seems to be the predominant narrative.
U.S. 10-YEAR TIPS – REAL INTEREST RATE
Source: Refinitiv
The implied Fed funds futures (see below) have shifted drastically from cuts beginning in September 2023 to the first cut priced in around May/June 2024 in a matter of a few months. Markets are looking for cracks in the US labor market to really change the current trajectory and until such time, bullion may remain under pressure. Escalating tensions in Russia may also play a part in supporting gold prices due to its safe haven appeal but as of now, markets remain dismissive.
FEDERAL RESERVE INTEREST RATE PROBABILITIES

Source: Refinitiv
Upcoming data today will provide greater insight on the US jobs market with jobless claims numbers in focus. Initial jobless claims will carry more weight as it measures new unemployment and the estimated figure is lower than the previous print which could once again bolster the greenback and weigh on gold.
Trade Smarter – Sign up for the DailyFX Newsletter
Receive timely and compelling market commentary from the DailyFX team
Subscribe to Newsletter
ECONOMIC CALENDAR
Source: DailyFX economic calendar
TECHNICAL ANALYSIS
XAU/USD DAILY CHART

Chart prepared by Warren Venketas, IG
Daily XAU/USD price action above, keeps gold prices within a falling wedge type chart pattern (black) while trading below both the 200-day MA (blue) and the psychological $1900 handle. Taking into account the Relative Strength Index (RSI) is nearing oversold territory, traders may look to exit short positions but a reversal could be risky for bulls looking to enter at this point. A fundamental catalyst will be required to form a strong directional bias once more and this could come from next week’s US PMI’s and the Jackson Hole Symposium.
Resistance levels:
- 1925.06
- 200-day MA/Wedge resistance
- 1900.00
Support levels:
- 1890.21/Wedge support
- 1858.33
IG CLIENT SENTIMENT: BEARISH
IGCS shows retail traders are currently distinctly LONG on gold, with 82% of traders currently holding long positions (as of this writing). Download the latest sentiment guide (below) to see how daily and weekly positional changes affect GOLD sentiment and outlook.
Introduction to Technical Analysis
Market Sentiment
Recommended by Warren Venketas
Contact and followWarrenon Twitter:@WVenketas


Comments are closed.