Price Action Trading Strategies – Analytics & Forecasts – 5 July 2023
Did you know that price action trading strategies are one of the most commonly used methods in today's financial market? Whether you are a short-term or long-term trader, analysing the price of a security is perhaps one of the simplest, yet also the most powerful, ways to gain an edge in the market.
After all, every single trading indicator in the world is derived from price, so it makes sense to actually study it, understand it, learn from it and use it in your trading. In this article, we cover all you need to know about price action trading explaining what it is, why you should consider using it with Forex and sharing four price action trading strategies suitable for both beginners and experienced traders alike.
What is Price Action?
The term ‘price action' is simply the study of a security's price movement. Traders using price action trading strategies look to study historical price to identify any clues on where the market could move next. The most commonly used price action indicator is the study of price bars which give details such as the open and closing price of a market and its high and low price levels during a specific time period.
Analysing this information is the core of price action trading. In fact, in answering the question ‘what is price action?', It could be said that it is really the study of the actions of all the buyers and sellers actively involved in any given market. Therefore, by analysing what the rest of the market participants are doing, it can give traders a unique edge in their trading decisions.
The most commonly used price bars which are used as a price action indicator, are called candlesticks. All trading platforms in the world offer candlestick charting – proving just how popular price action trading is.
What is a Price Action Indicator?
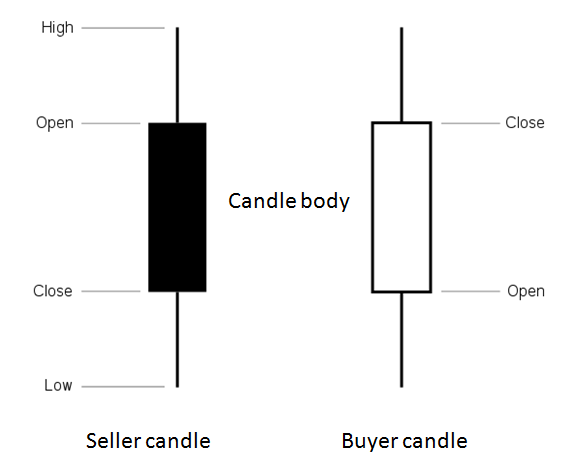
As discussed above, we now know that price action is the study of the actions of all buyers and sellers actively involved in a given market. The most commonly used price action indicator is a candlestick, as it gives the trader useful information such as the opening and closing price of a market and the high and low price levels in a user-defined time period. Let's look at an example:

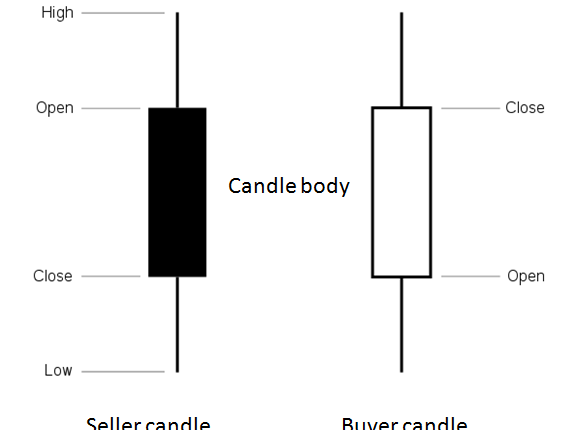
If you were to view a daily chart of a security, the above candles would represent a full day's worth of trading. Both candles give useful information to a trader:
- The high and low price levels tell us the highest price and lowest price made in the trading day.
- The seller candle, shown by a black, or sometimes red, body tells us that sellers won the battle of the trading day. This is because the closing price level is lower than the opening price level.
- The buyer candle, shown by a white, or sometimes green, body tells us that buyers won the battle of the trading. This is because the closing price level is higher than the opening price level.
Using this simple candle setup is one of the first steps towards creating a price action strategy. For example:
- If after the seller candle, the next candle goes on to make a new low then it is a sign that sellers are willing to keep on selling the market. This weakness will cause some traders to initiate short (sell) positions or hold on to the short positions they already have.
- If after the buyer candle, the next candle goes on to make a new high then it is a sign that buyers are willing to keep on buying the market. This strength will cause some traders to initiate long (buy) positions, or hold on to the long positions they already have.
This type of price action analysis is just one way to use candlesticks as a price action indicator. However, the candles themselves often form patterns that can be used to form price action trading strategies. Before we look at these patterns, let's first look at where they work best.
Learn more about price action trading and other trading related topics by subscribing to our channel.


Comments are closed.