

Gold, XAU/USD, Silver, XAG/USD – Technical Outlook:
- Gold has lost some of its shine but continues to hold above the 200-day moving average.
- Silver has turned bearish after the break below key support.
- What are the key levels to watch?
Recommended by Manish Jaradi
How to Trade Gold
GOLD TECHNICAL OUTLOOK – NEUTRAL
Precious metals appear to be losing shine after US Federal Reserve Chair Jerome Powell stepped up higher rates rhetoric in his semi-annual testimony to lawmakers on Tuesday.
Powell said the ultimate rate peak is likely to be higher than expected and the central bank is prepared to increase the pace of rate hikes if needed. In his previous appearance a month ago, Powell emphasized the ‘disinflation’ theme and stopped short of adopting an aggressive tone following a strong US jobs report. The increased hawkishness on Tuesday pushed the US Treasury 2-year yield to its highest level since 2007, weighing on precious metals.
The odds of a 50-bps rate hike at the March 21-22 FOMC meeting have increased, with US rate futures now pricing in a terminal fed funds rate at 5.63% by September from 5.48% before Powell’s testimony, and 5% at the end of January, close to 100 bps higher than the current Fed policy rate of 4.50%-4.75%.
XAU/USD Daily Chart
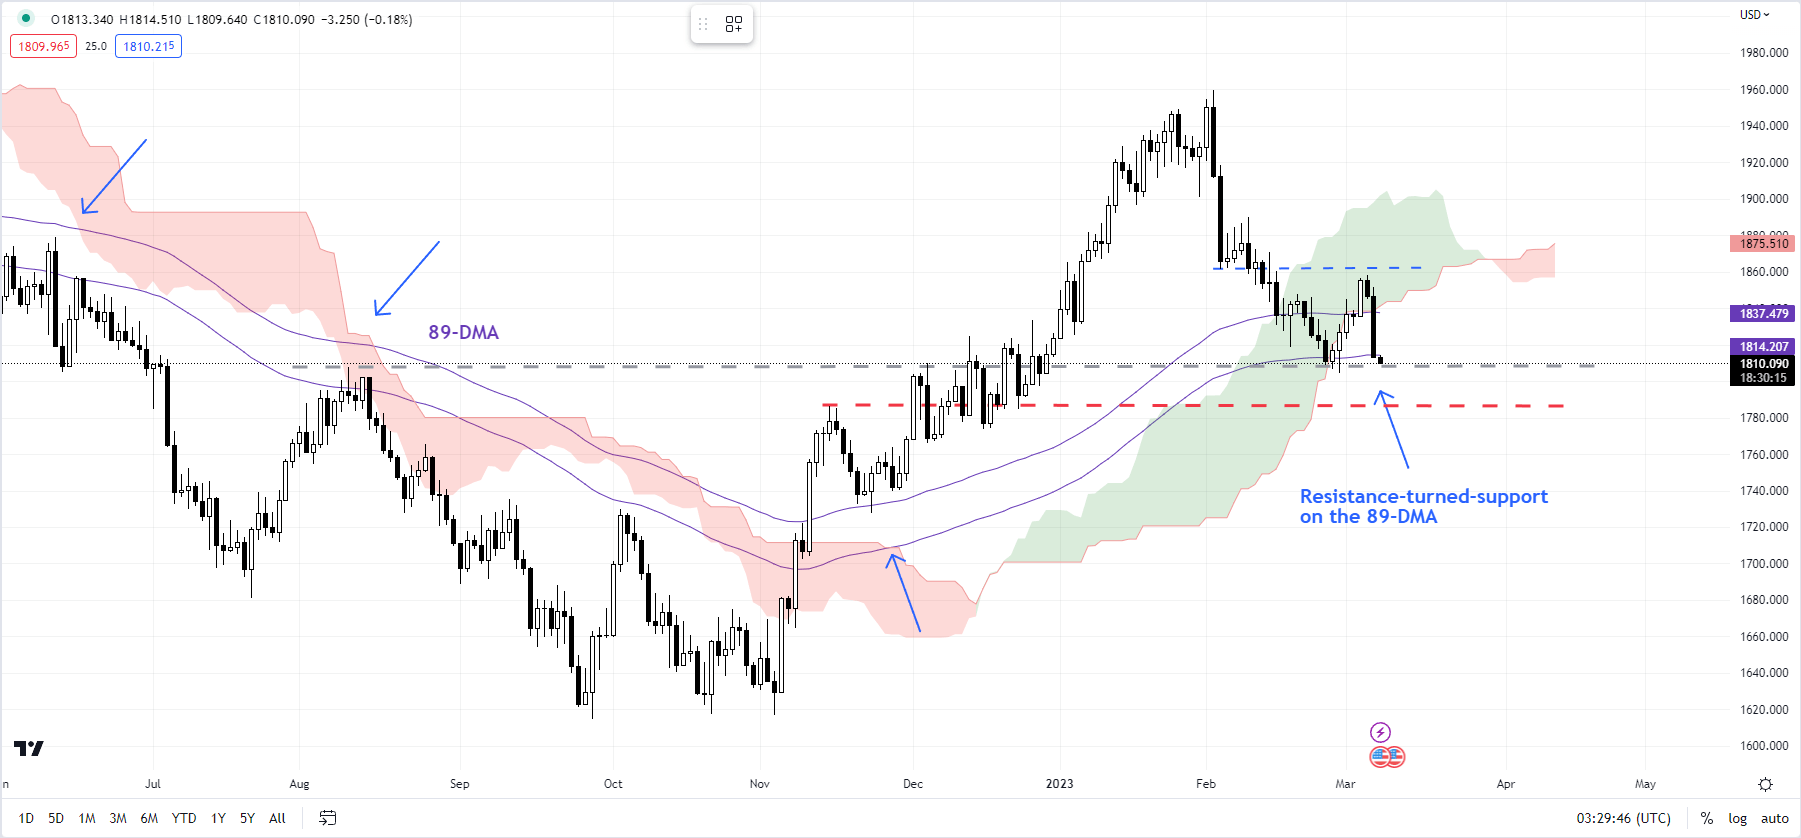
Chart Created Using TradingView
The key focus is now on US jobs data due Mar. 10 and US CPI due Mar. 14. Non-farm payrolls grew 224,000 in February, slower from 443,000 in January, while unemployment is expected to hold near the five-decade low of 3.4%. Consumer price inflation slowed to 6.0% on-year in February from 6.4% in January, but core CPI remained steady at 0.4% on-month. Stronger-than-expected US data could continue to weigh on precious metals.
XAU/USD 240-minute Chart
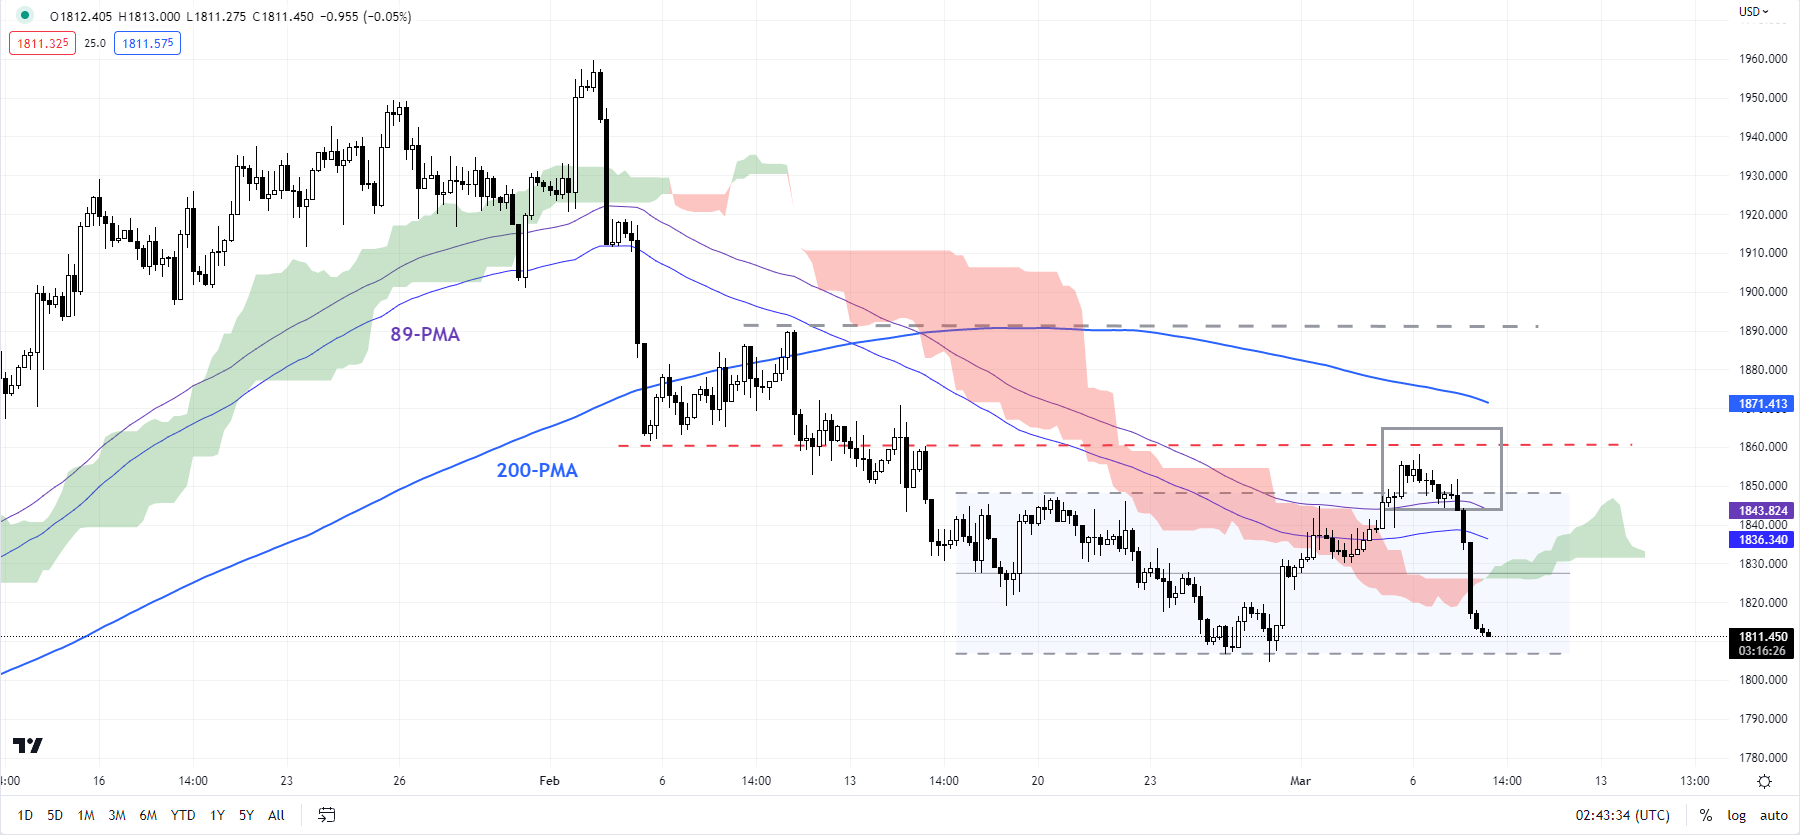
Chart Created Using TradingView
In recent days, XAU/USD has failed to decisively cross above a converged cap on a horizontal trendline from late February (at about 1847) and the early-February low of 1860. For more details see “Gold Looks to Powell for a Confirmation,” published March 6. This follows a rebound from near-strong support at the end-February low of 1804, coinciding with the 89-day moving average. See “Gold Technical Outlook: A Turnaround on the Cards?”, published March 1.
Unless XAU/USD falls the vital cushion zone of 1774-1786, the technical outlook continues to be neutral. The converged area includes the mid-November low of 1774, the 50% retracement of the November-February rise, and the 200-day moving average. Any fall below would derail the rally from the end of 2022.
XAG/USD Daily Chart
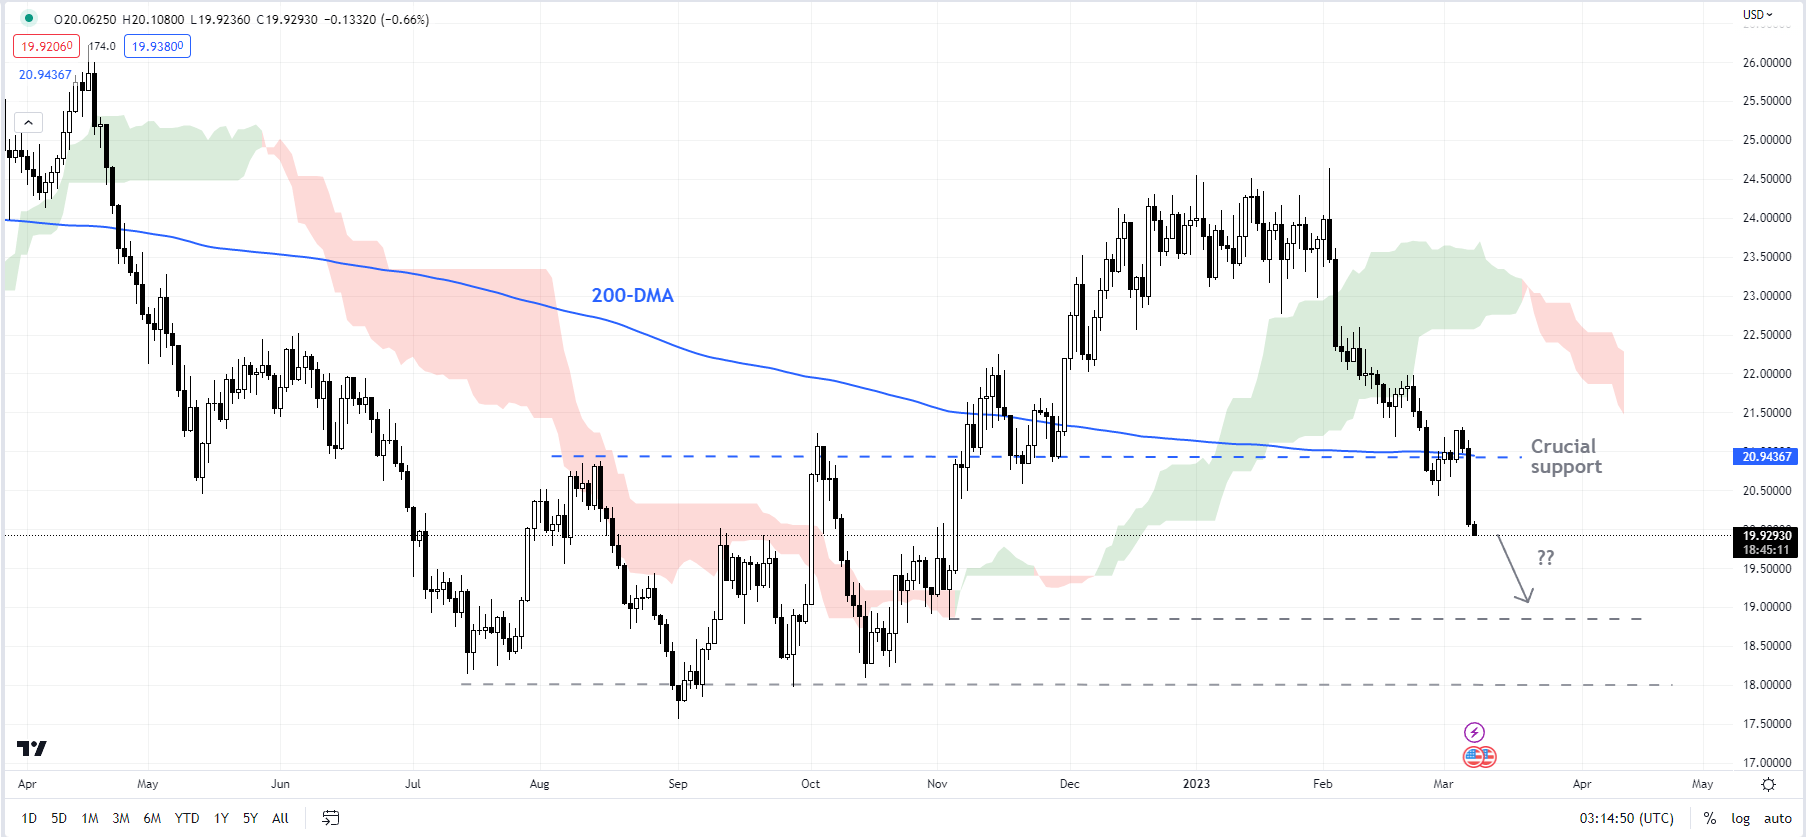
Chart Created Using TradingView
SILVER TECHNICAL OUTLOOK – BEARISH
XAG/USD’s fall below a horizontal trendline from October at about 21.25 has confirmed that the four-month-long uptrend has ended. The bearish break has exposed downside risks toward the September low of 17.50. Unless XAG/USD can clear the immediate ceiling at Monday’s high of 21.30, the path of least resistance remains sideways to down.
Trade Smarter – Sign up for the DailyFX Newsletter
Receive timely and compelling market commentary from the DailyFX team
Subscribe to Newsletter
— Written by Manish Jaradi, Strategist for DailyFX.com
Comments are closed.