PMI Data, US Yields Provide USDJPY Reprieve
USD/JPY News and Analysis
- Bonds rise after terrible PMI data weakens the global growth outlook
- IG Client Sentiment favors a continuation of the longer-term trend
- Enter Jackson Hole – the focal point of this week
- The analysis in this article makes use of chart patterns and key support and resistance levels. For more information visit our comprehensive education library
Recommended by Richard Snow
How to Trade USD/JPY
Bonds Rise After Terrible PMI Data Weakens the Global Growth Outlook
Worsening UK, EU and US PMI data has sent US treasuries higher, lowering yields and providing a reprieve for USD linked markets. In the wake of deteriorating Chinese data, the latest round of PMI data provides further evidence of the impact of higher rates on economic activity. EU and UK data was particularly bad and even though US services PMI remains above the 50 mark, it too is heading lower.
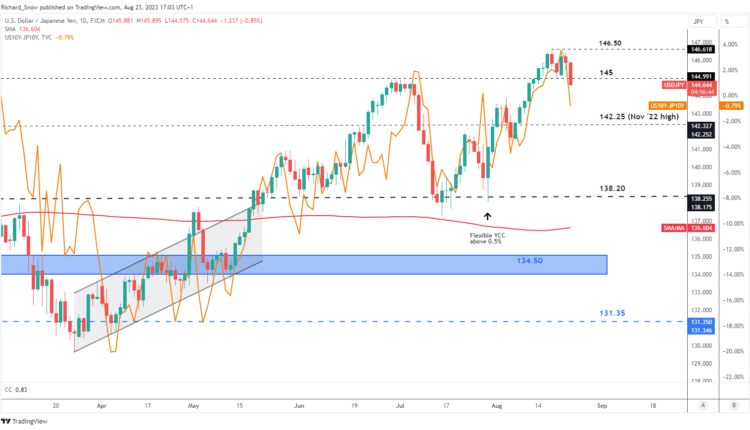
The data provided the catalyst to send Treasury bond yields and the US dollar lower, allowing a moments reprieve for USD/JPY. Price action had been stalling around 145.00 after the threat of possible intervention from the Japanese finance ministry. More recently, the finance minister clarified that the level of USD/JPY was less of a concern than the volatility of undesirable depreciation of the yen.
Therefore, if the current move lower proves to be short-lived, markets may soon be emboldened to push beyond 145 with an eye on 150 – a level identified by JP Morgan earlier this week as the next key level attracting Tokyo’s attention.
USD/JPY Daily Chart
Source: TradingView, prepared by Richard Snow
IG Client Sentiment Favours longer-term uptrend

Source: TradingView, prepared by Richard Snow
USD/JPY:Retail trader data shows 20.57% of traders are net-long with the ratio of traders short to long at 3.86 to 1.We typically take a contrarian view to crowd sentiment, and the fact traders are net-short suggests USD/JPY prices may continue to rise.
Find out more about how to read the contrarian indicator (below) and see the daily and weekly changes in positioning here.
| Change in | Longs | Shorts | OI |
| Daily | -2% | -5% | -4% |
| Weekly | -6% | -7% | -7% |
Major Risk Events for the Rest of the Week
Markets continue to look ahead to Jerome Powell’s appearance at Jackson Hole on Friday.
Customize and filter live economic data via our DailyFX economic calendar
Trade Smarter – Sign up for the DailyFX Newsletter
Receive timely and compelling market commentary from the DailyFX team
Subscribe to Newsletter
— Written by Richard Snow for DailyFX.com
Contact and follow Richard on Twitter: @RichardSnowFX


Comments are closed.