

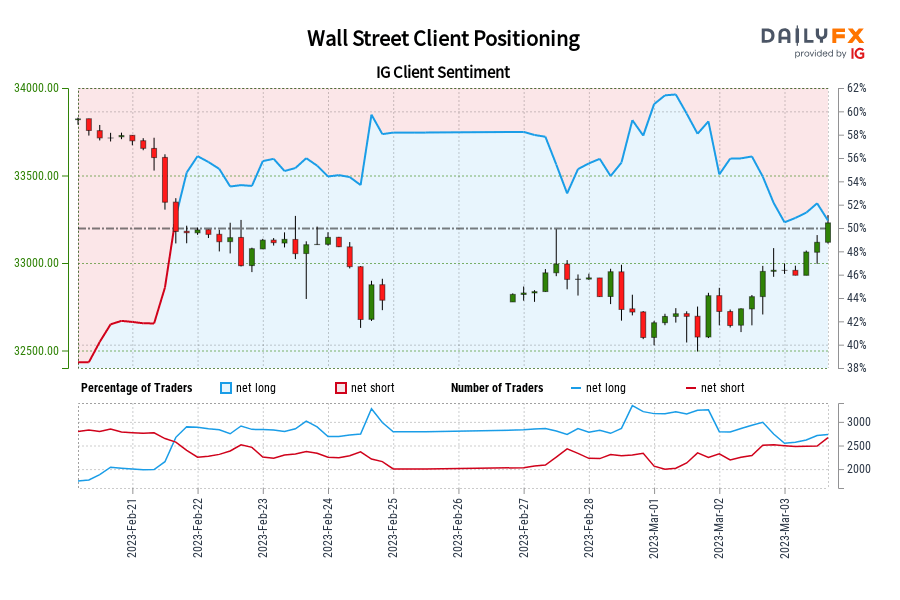
Our data shows traders are now net-short Wall Street for the first time since Feb 21, 2023 when Wall Street traded near 33,173.00.
Number of traders net-short has increased by 22.93% from last week.
| SYMBOL | TRADING BIAS | NET-LONG% | NET-SHORT% | CHANGE IN LONGS | CHANGE IN SHORTS | CHANGE IN OI |
|---|---|---|---|---|---|---|
| Wall Street | BULLISH | 49.26% | 50.74% |
-12.90% Daily -18.07% Weekly |
8.60% Daily 22.93% Weekly |
-3.18% Daily -1.38% Weekly |
Wall Street: Retail trader data shows 49.26% of traders are net-long with the ratio of traders short to long at 1.03 to 1. In fact, traders have remained net-short since Feb 21 when Wall Street traded near 33,173.00, price has moved 0.17% higher since then. The number of traders net-long is 12.90% lower than yesterday and 18.07% lower from last week, while the number of traders net-short is 8.60% higher than yesterday and 22.93% higher from last week.
We typically take a contrarian view to crowd sentiment, and the fact traders are net-short suggests Wall Street prices may continue to rise.
Our data shows traders are now net-short Wall Street for the first time since Feb 21, 2023 when Wall Street traded near 33,173.00. Traders are further net-short than yesterday and last week, and the combination of current sentiment and recent changes gives us a stronger Wall Street-bullish contrarian trading bias.
Comments are closed.