Oil Prices Fail to Hold Post-Fed Gains, Charts Look Heavy
Crude Oil Price, Chart, and Analysis
- Oil prices made fleeting gains after US rates rose as expected
- Major producers agreed to extend their production cuts on Wednesday
- US inventories rose by much more than expected
Oil prices slipped back in Thursday’s European session after short-lived gains in Asia following the United States Federal Reserve’s quarter-point interest rate hike.
Despite higher borrowing costs the US Dollar initially weakened after Fed Chair Jerome Powell said that the ‘disinflation process has started’ even as price rises remain relatively strong. The central bank said that ongoing rate rises remain appropriate, but markets clearly believe that the bulk of such increases are now behind them. This view would seem to be highly dependent on inflation continuing to relax, however.
In any case, a weaker greenback makes Dollar-priced oil less expensive in other currencies and can boost demand.
OPEC and Russia Stick with Production Cuts
In more oil-market-specific news, the Organization of Petroleum Exporting Countries and Russia agreed on Wednesday to stick with production cuts agreed upon back in November. In a virtual meeting that reportedly lasted less than thirty minutes, producers concurred that the two-million-barrel daily output cut should stand. Introduced to support the market, the deal runs through until the end of 2023.
There was less-supportive news for crude in official inventory data which showed a rise of 4.1 million barrels in stocks for the week ending on January 27. This was hugely ahead of the 400,000 barrel rise forecast and the sixth straight week of inventory gains.
Thursday’s data schedule hasn’t got a lot for the oil markets, but official stock numbers for US natural gas are coming up and may grab some attention.
Crude oil prices have posted modest gains into 2023 but, with recession worries hovering over many national economies as interest rates continue to rise, fears about levels of end-user energy demand would seem to be keeping a natural lid on prices.
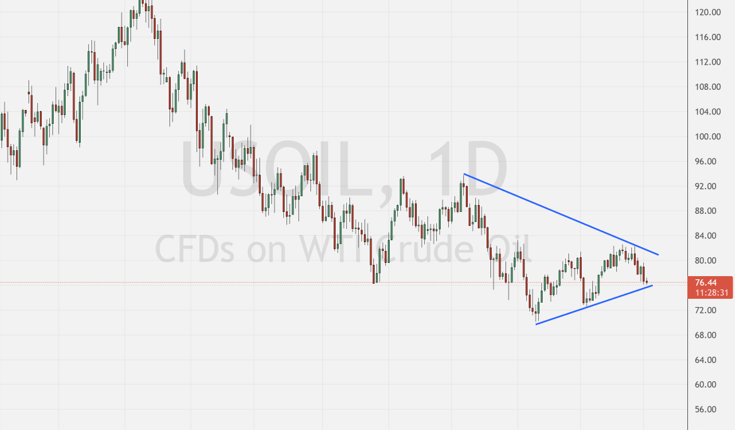
Moreover, the long downtrend in place since US crude topped out above $125/barrel back in March 2022 remains clearly visible.
Crude Oil Technical Analysis
Chart Compiled by David Cottle Using TradingView
US crude prices are stuck between a convergent uptrend and downtrend lines. This is what’s known as a pennant formation and that in turn is one of the ‘continuation patterns.’
What that means is that the market is likely to continue doing what it was doing before the formation began to build once it plays out. At face value this looks like bad news for oil-market bulls because it seems to suggest that further falls are likely.
The peaks of October and November 7 also look worryingly like a double top formation, one which, again, might signal further weakness.
For now, if the bulls are going to turn matters around, then they will need to recapture January 23’s high of $82.52. If they can do that they can break above the downtrend channel in place since that November top, but a retest of December 9’s low of $69.58 looks like a more realistic near-term prospect.
There’s certainly plenty of bearish sentiment baked into the market at present. Of IG clients, fully 77% now take the view that prices have further to fall. While this sort of certainty may make the contrarian call attractive, evidence from the charts suggests that sustained rises would be a bold call now.
–By David Cottle for DailyFX


Comments are closed.