Oil Price Remains Bid Ahead of OPEC+ Meeting, US NFPs
Oil Prices, Charts, and Analysis
- Oil bolstered by Saudi Arabia, Russia output cuts
- OPEC+ meeting and US Jobs Report later.
Recommended by Nick Cawley
Get Your Free Oil Forecast
The price of oil is trying to make a fresh three-month high after Saudi Arabia and Russia extended their output cuts yesterday. Saudi Arabia announced that it would extend its one million barrels a day cut by a further month until the end of September, while Russia said that it would cut output by 300,000 barrels a day next month. Yesterday’s announcement followed Wednesday’s news of a sharp drop in crude oil stocks. The weekly EIA report showed a much larger-than-expected stock draw of 17 million barrels, dwarfing the predicted -1.367 million barrels and a prior week’s -0.6 million.
Today’s OPEC+ meeting is due later but no additional action is expected. Also today, the latest US Jobs Report will show the current strength of the labor market and will set the risk tone for the week ahead.
For all market-moving events and economic data releases, see the real-time DailyFX Calendar
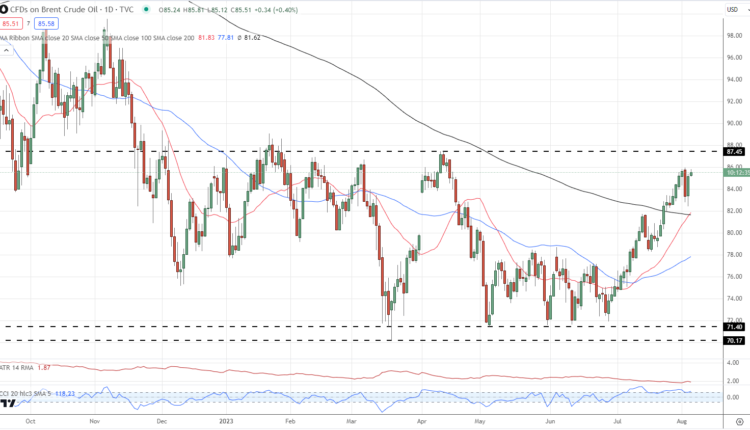
Brent oil remains in a multi-week bullish channel and is a couple of dollars away from levels last seen in early April this year. Ongoing oil demand is pushing the price higher as fears of a recession in the US continue to fade. The daily chart also shows a bullish 20-day/200-day simple moving average crossover, driven by the sharp move higher in the shorter-dated average, while the CCI indicator suggests that the market is overbought, but not excessively. Short-term support is seen between $81.60/bbl. and $82.50/bbl.
Brent Oil Daily Price Chart – August 4, 2023
Recommended by Nick Cawley
How to Trade Oil
The US oil chart is very similar to the UK chart with a bullish crossover and prices nearing the mid-April peak. Short-term support down to $78.00bbl.
US Oil Daily Price Chart

Charts via TradingView
Retail Traders are Net-Short US Crude Oil
Retail trader data shows 35.70% of traders are net-long with the ratio of traders short to long at 1.80 to 1. Large weekly shifts are driving sentiment. You can download the full US oil sentiment report below.
| Change in | Longs | Shorts | OI |
| Daily | -4% | -1% | -2% |
| Weekly | -9% | 36% | 15% |
What is your view on the Oil – bullish or bearish?? You can let us know via the form at the end of this piece or you can contact the author via Twitter @nickcawley1.


Comments are closed.