Nasdaq 100 Dips as Soft ISM Services Data Fuels Economic Woes, Will Support Hold?
Nasdaq 100, ISM Services Index, Fed, Technical Analysis – Asia Pacific Market Open:
- Tech-heavy Nasdaq 100 underperforms after soft ISM Services data
- Traders seemed to focus on economic woes rather than a dovish Fed
- Turn lower has the Nasdaq facing a key zone of support, will it hold?
Recommended by Daniel Dubrovsky
Get Your Free Equities Forecast
Asia-Pacific Market Briefing – Tech Stocks Sink on Soft US Data
On Wall Street, the tech-heavy Nasdaq 100 underperformed the Dow Jones and S&P 500, falling over 1%. That was the worst performance in 2 weeks. This followed a round of disappointing US economic data. The first was ADP payrolls, which missed expectations. However, the markets did not pay much attention to this print. That might be due to its unreliable property of predicting non-farm payrolls report.
Instead, traders focus on the ISM non-manufacturing PMI print. The gauge of service activity crossed the wires at 51.2, much lower than the 54.4 estimate for March. This is down from 55.1 prior. Readings above 50 still indicate expanding economic activity, but it is the trend that is the most concerning. The ISM data has been gradually falling since the end of 2021.
The service sector is the largest segment of the economy. As such, further deterioration could spell trouble for growth. Markets increased dovish Federal Reserve policy expectations as Treasury yields declined. This time, tech stocks fell as traders likely focused on the negative economic implications of unexpectedly softer data that may allude to higher chances of a recession.
Looking at Thursday’s Asia-Pacific trading session, Caixin China PMI data will cross the wires. The world’s second-largest economy has been gradually recovering from the Covid-zero strategy. Further signs of health could improve risk appetite. Otherwise, regional stock exchanges could be looking at volatility over the remaining hours, following Wall Street’s mood.
Nasdaq 100 Technical Analysis
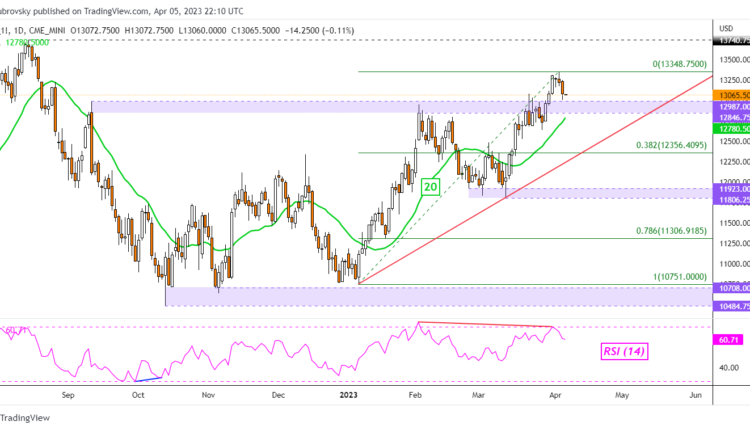
On the daily chart, the Nasdaq 100 is back to facing the 12846 – 12987 former resistance zone. It could hold as new support, pivoting prices higher and reinforcing this range as an inflection point. If not, extending lower would offer an increasingly near-term bearish technical bias. However, keep in mind that the rising trendline from January is maintaining the broader upside trajectory.
Trade Smarter – Sign up for the DailyFX Newsletter
Receive timely and compelling market commentary from the DailyFX team
Subscribe to Newsletter
Chart Created in TradingView
— Written by Daniel Dubrovsky, Senior Strategist for DailyFX.com
To contact Daniel, follow him on Twitter:@ddubrovskyFX


Comments are closed.