Mexican Peso extends its downside around 17.50 amid a stronger Dollar
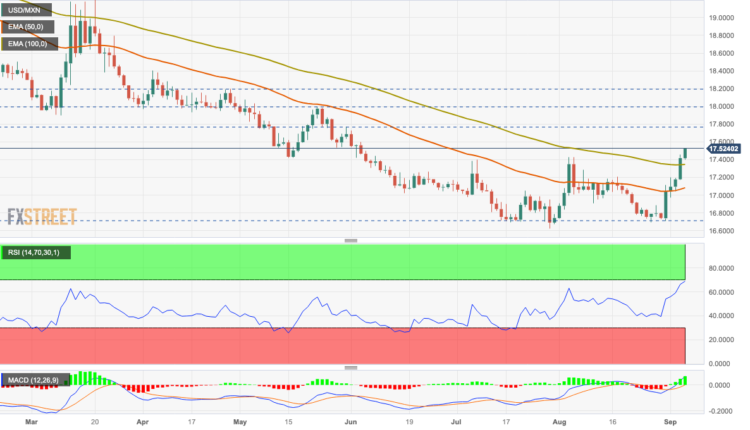
- USD/MXN gains momentum for the fourth straight day, holds above the 50- and 100-day EMAs on the daily chart.
- Relative Strength Index (RSI) stands above 50 and MACD is located in bullish territory.
- The immediate resistance level is seen at 17.77; the first support level is located at 17.35.
The Mexican Peso (MXN) trades in negative territory for the fourth consecutive day against the US Dollar (USD). USD/MXN currently trades near 17.50, gaining 0.48% on the day.
From the technical perspective, USD/MXN just holds above the 50- and 100-day Exponential Moving Averages (EMAs) on the daily chart, which means the path of the least resistance is to the upside. Meanwhile, the Relative Strength Index (RSI) stands above 50 and the Moving Average Convergence/Divergence (MACD) is located within the bullish territory, suggesting that buyers the further upside looks favorable for the time being.
Therefore, the pair could meet the immediate resistance level at 17.77 (a high of May 31). The additional upside filter to watch is near a psychological round mark and a high of May 24 at 18.00. Further north, the next barrier is seen at 18.20 (a high of April 27) and finally at 18.40 (a high of April 5).
On the downside, the first support level is seen at 17.35, representing the 50-day EMA. Any extended weakness below the latter will challenge the critical contention at the 17.00-17.10 region. The mentioned level is a confluence of the midline of Bollinger Band, a psychological round figure, and the 50-day EMA. The next downside stop to watch is near a Year-To-Date (YTD) low of 16.60. Further south, the pair will see a drop to a psychological round figure at 16.00.
USD/MXN daily chart


-638295808845666060.png)
Comments are closed.