
US Dollar (DXY) News and Analysis
- Positive manufacturing data lifts the downtrodden dollar
- DXY technical considerations: bounce at support provides support for developing pullback
- The analysis in this article makes use of chart patterns and key support and resistance levels. For more information visit our comprehensive education library
Recommended by Richard Snow
See what our analysts foresee in Q1 for USD
Positive Manufacturing Data Lifts the Downtrodden Dollar
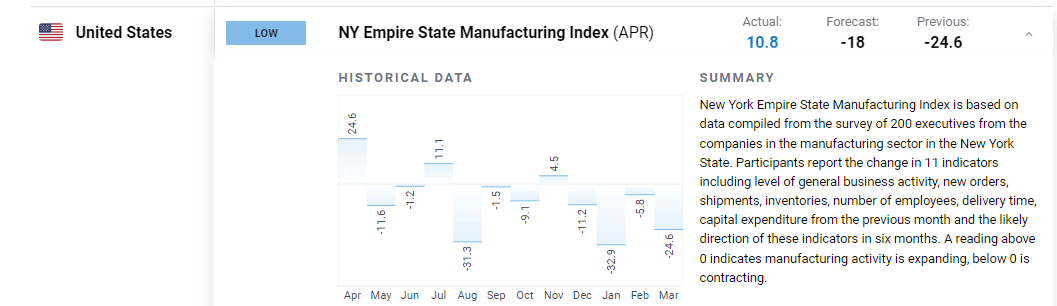
In a rather unexpected turn, the dollar has received a welcomed boost after significantly better than expected data from the NY Empire State Manufacturing Index. The index, after registering four successive prints below zero (indicating a contraction), rose to 10.8 when only forecasted to come in at -18.

Customize and filter live economic data via our DailyFX economic calendar
US Dollar Basket (DXY) Technical Considerations
Manufacturing data as a whole has lagged the more important services industry but the latest pick up in the NY Empire State variation has sent the dollar higher on the day thus far, extending the pullback that gained traction towards the end of last week.
Dollar Basket 5-Minute Chart
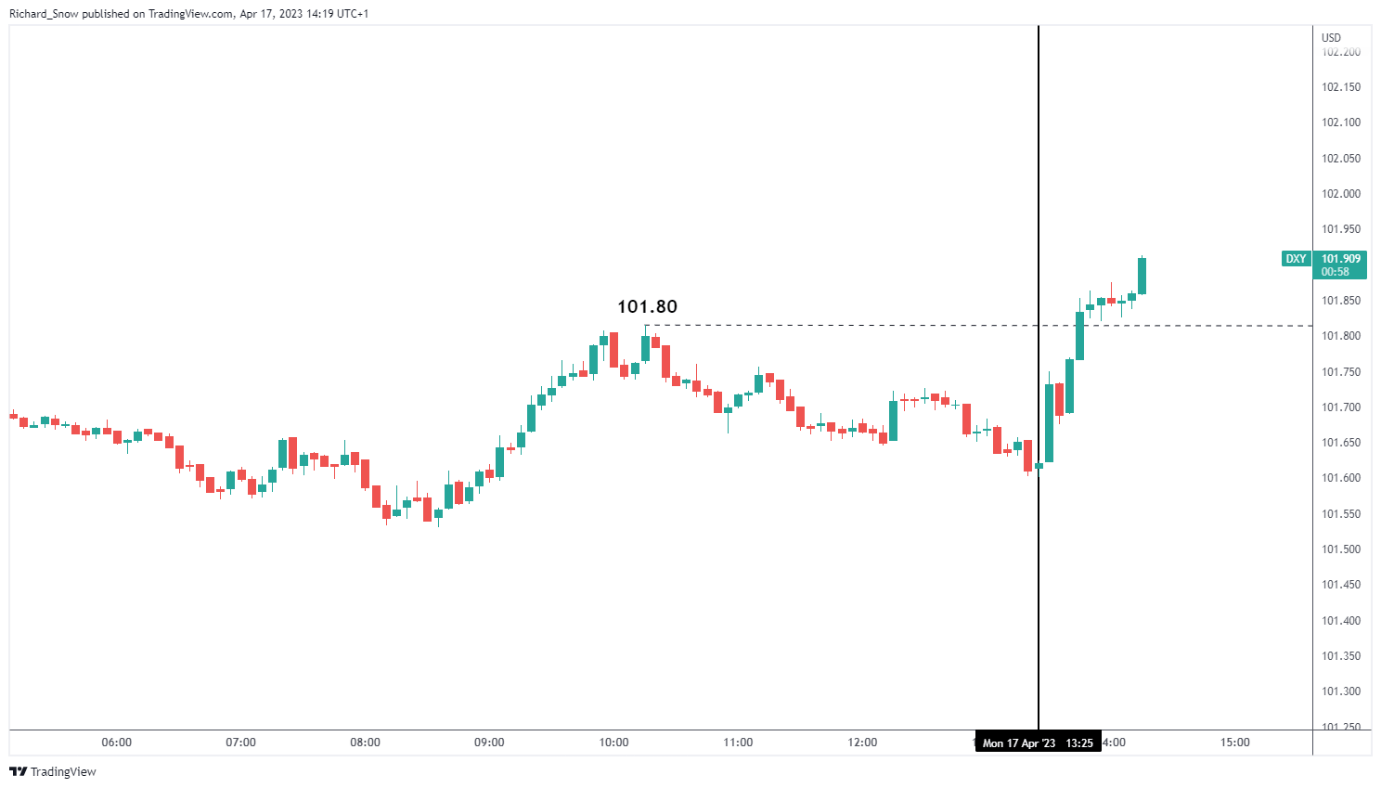
Source: TradingView, prepared by Richard Snow
The dollar has roughly been trading in-line with the 10-year treasury yield and the latest move to the upside coincides with another leg higher in US rates. DXY remains within the descending channel as the broader bearish trend continues. However, if a reversal is afoot, dollar bulls will be on the lookout for a bullish channel breakout and an attempt at trading towards 103.00.
A bearish continuation entertains lower levels like 101.30 and the psychologically important 100 level.
US Dollar Basket (DXY) Daily Chart with the 10-Year Treasury Yield
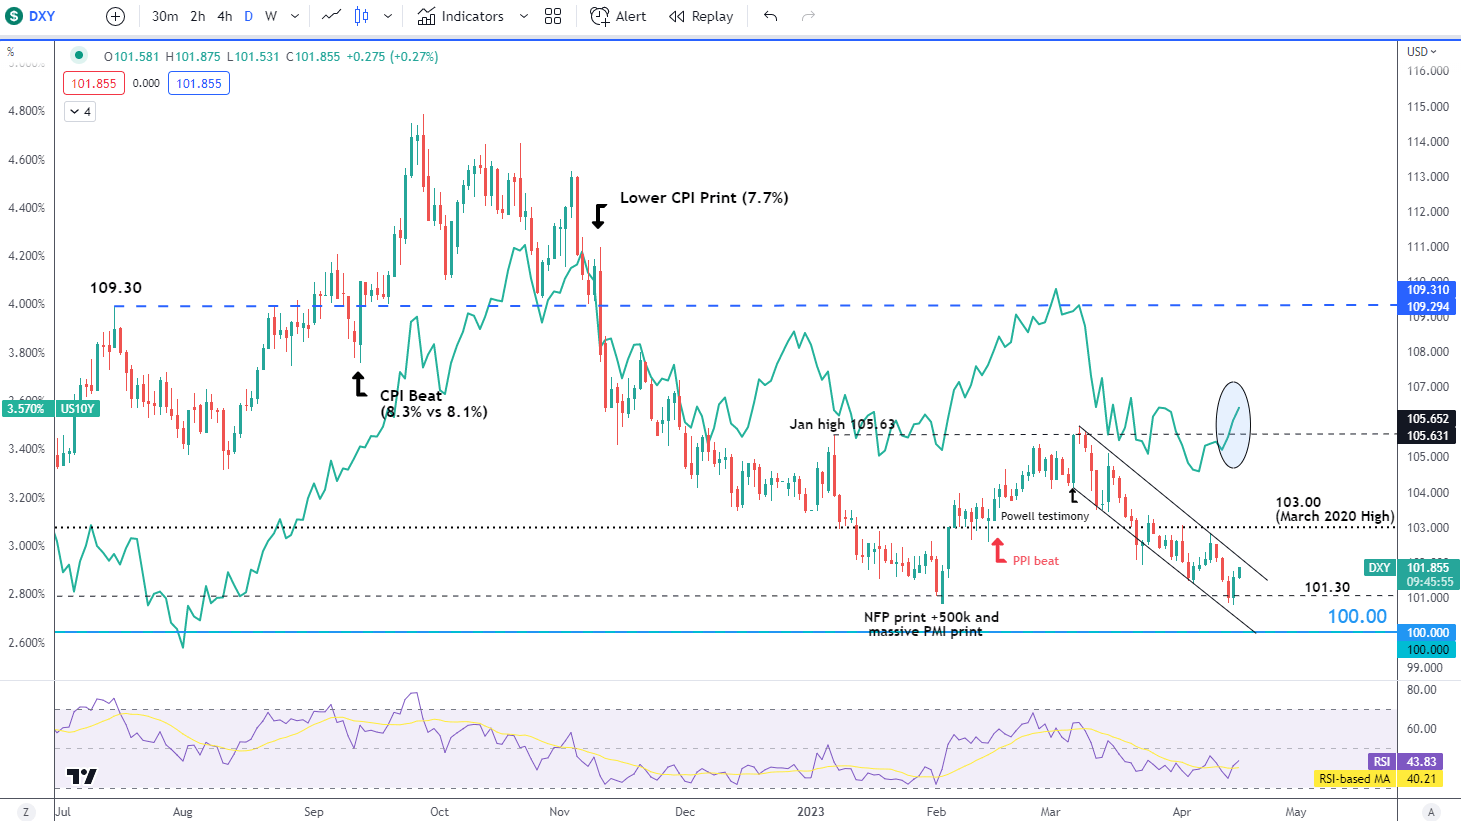
Source: TradingView, prepared by Richard Snow
There is something to be said about a potential dollar pullback as last week’s US inflation data proved that despite headline inflation dropping like a stone, core inflation (headline inflation excluding more volatile items like fuel and food) edged slightly higher. This now has markets revising their interest rate expectations higher, which is supportive of a brief dollar pullback at least. The weekly chart below suggests that a short-medium term reversal may be in the works as prices failed to selloff beyond 100.85 and now trade higher.
DXY Weekly Chart
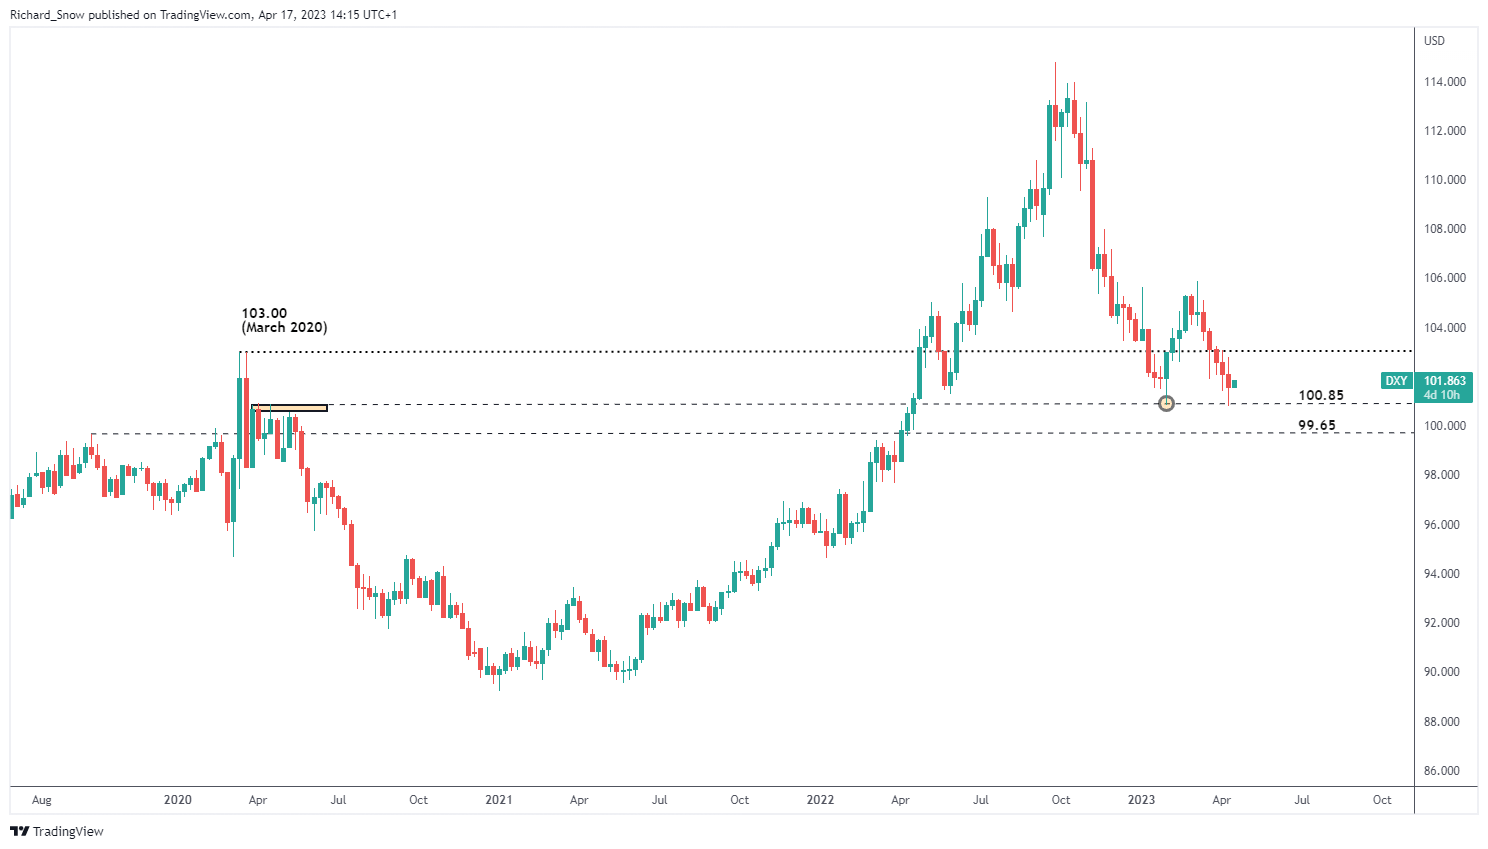
Source: TradingView, prepared by Richard Snow
— Written by Richard Snow for DailyFX.com
Contact and follow Richard on Twitter: @RichardSnowFX
Comments are closed.