Japanese GDP Supportive of BOJ Policy Shift
USD/JPY ANALYSIS & TALKING POINTS
- Japan’s GDP report gives hawks hope.
- US debt ceiling dominates headlines and price action as markets yearn for more clarity.
- 200-day MA under threat while ascending triangle breakout not far away.
Recommended by Warren Venketas
Get Your Free JPY Forecast
JAPANESE YEN FUNDAMENTAL BACKDROP
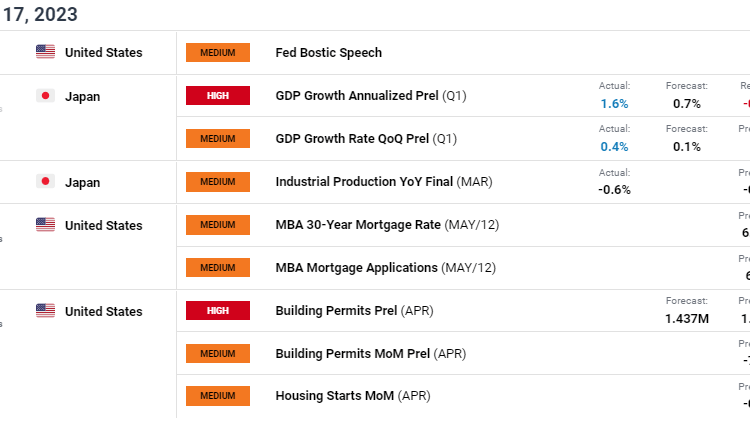
The Japanese Yen looks to be heading for its 5th consecutive loss against the USD after last nights US debt ceiling negotiations showed some positivity but not enough to ease market concerns just yet. Investors remain in favor of the greenback as a safe haven currency as opposed to the yen. This preference was even clearer after stellar Japanese GDP numbers (see economic calendar below) were unable to deter the recent trend.
ECONOMIC CALENDAR (GMT +02:00)
Source: DailyFX economic calendar
From a Japanese perspective, the positive economic growth will lead nicely to elevated inflation levels (above their 2% target) and potentially result in some form of policy change – most likely by adjusting the current Yield Curve Control (YCC) conditions in the near future.
Foundational Trading Knowledge
Macro Fundamentals
Recommended by Warren Venketas
Bank of Japan (BOJ) money market pricing shows no real material change as expected upcoming meetings could be the start of the aforementioned changes by which hawkish repricing could take place.
BOJ INTEREST RATE PROBABILITIES

Source: Refinitiv
Later today, US building permit data will be the focal point for the pair and is projected to come in marginally higher than the March print. Further US debt ceiling statements could add to volatility as it takes centre stage over other macro data.
TECHNICAL ANALYSIS
Trade Smarter – Sign up for the DailyFX Newsletter
Receive timely and compelling market commentary from the DailyFX team
Subscribe to Newsletter
USD/JPY DAILY CHART
Chart prepared by Warren Venketas, IG
USD/JPY shows price action now looking to retest the 200-day moving average (blue) for the first time since the beginning of May as the pair continues to trade within the developing ascending triangle pattern (black). A confirmation close above the 200-day MA could bring into consideration the triangle resistance breakout coinciding with the 137.91 March swing high.
That being said, the Relative Strength Index (RSI) could move back into overbought territory possibly hinting at yet another rejection by bears around this key area of confluence.
Key resistance levels:
- 137.91/Triangle resistance
- 200-day MA (blue)
Key support levels:
- 135.00
- Triangle support/133.63/50-day MA (yellow)
- 131.58
IG CLIENT SENTIMENT: BULLISH
IGCS shows retail traders are currently net SHORT on USD/JPY, with 63% of traders currently holding short positions (as of this writing). At DailyFX we take a contrarian view on sentiment resulting in a short-term downside disposition.
Contact and followWarrenon Twitter:@WVenketas


Comments are closed.