Is this a healthy pullback or the prelude to a market crash? This analogue reveals clues [Video]
Watch the video extracted from the WLGC live session before market open on 24 Oct 2023 below to find out the following:
-
How to use an analogue comparison to judge the current market trend?
-
The existing red flag that traders and investors need to be very cautious
-
The bearish case that the bull must watch out for
-
The key level the S&P 500 needs to commit to kick-start a relief rally
-
And a lot more
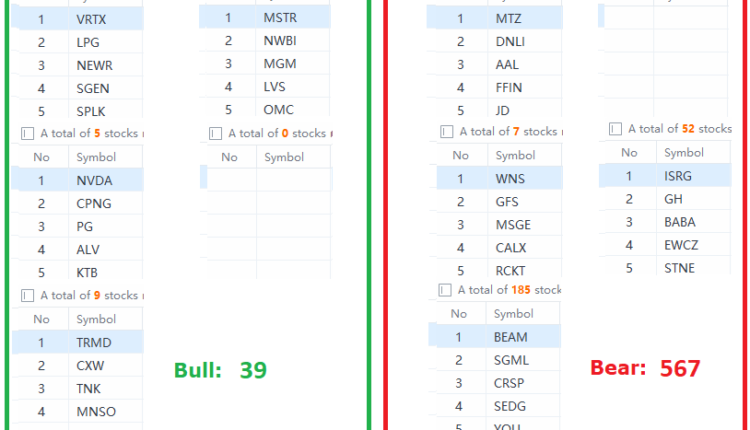
The bullish vs. bearish setup is 39 to 567 from the screenshot of my stock screener below pointing to a negative market environment.
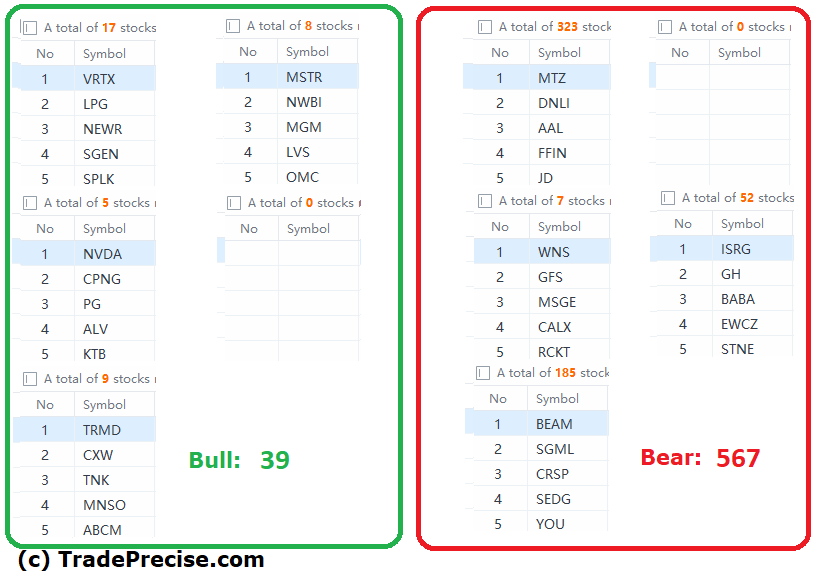
Despite the long-term market breadth signals a red flag while the short-term market breadth approaches the deeply oversold level, it is critical to monitor the S&P 500 as discussed in the video to get the confirmation.
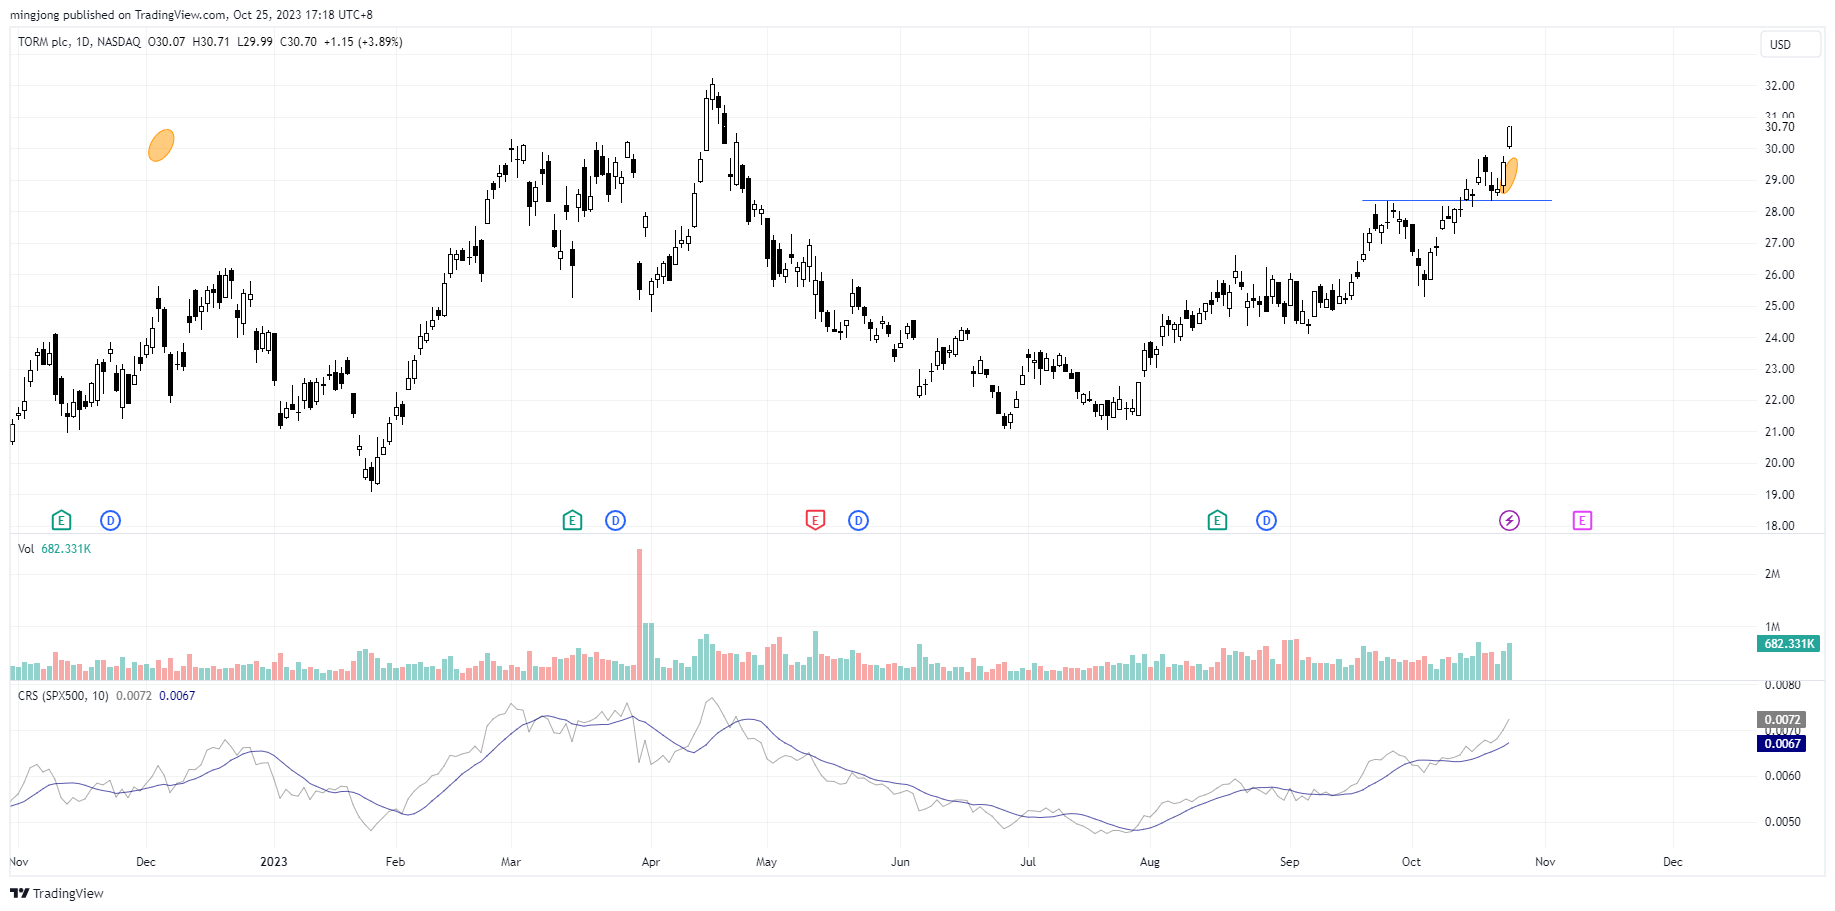
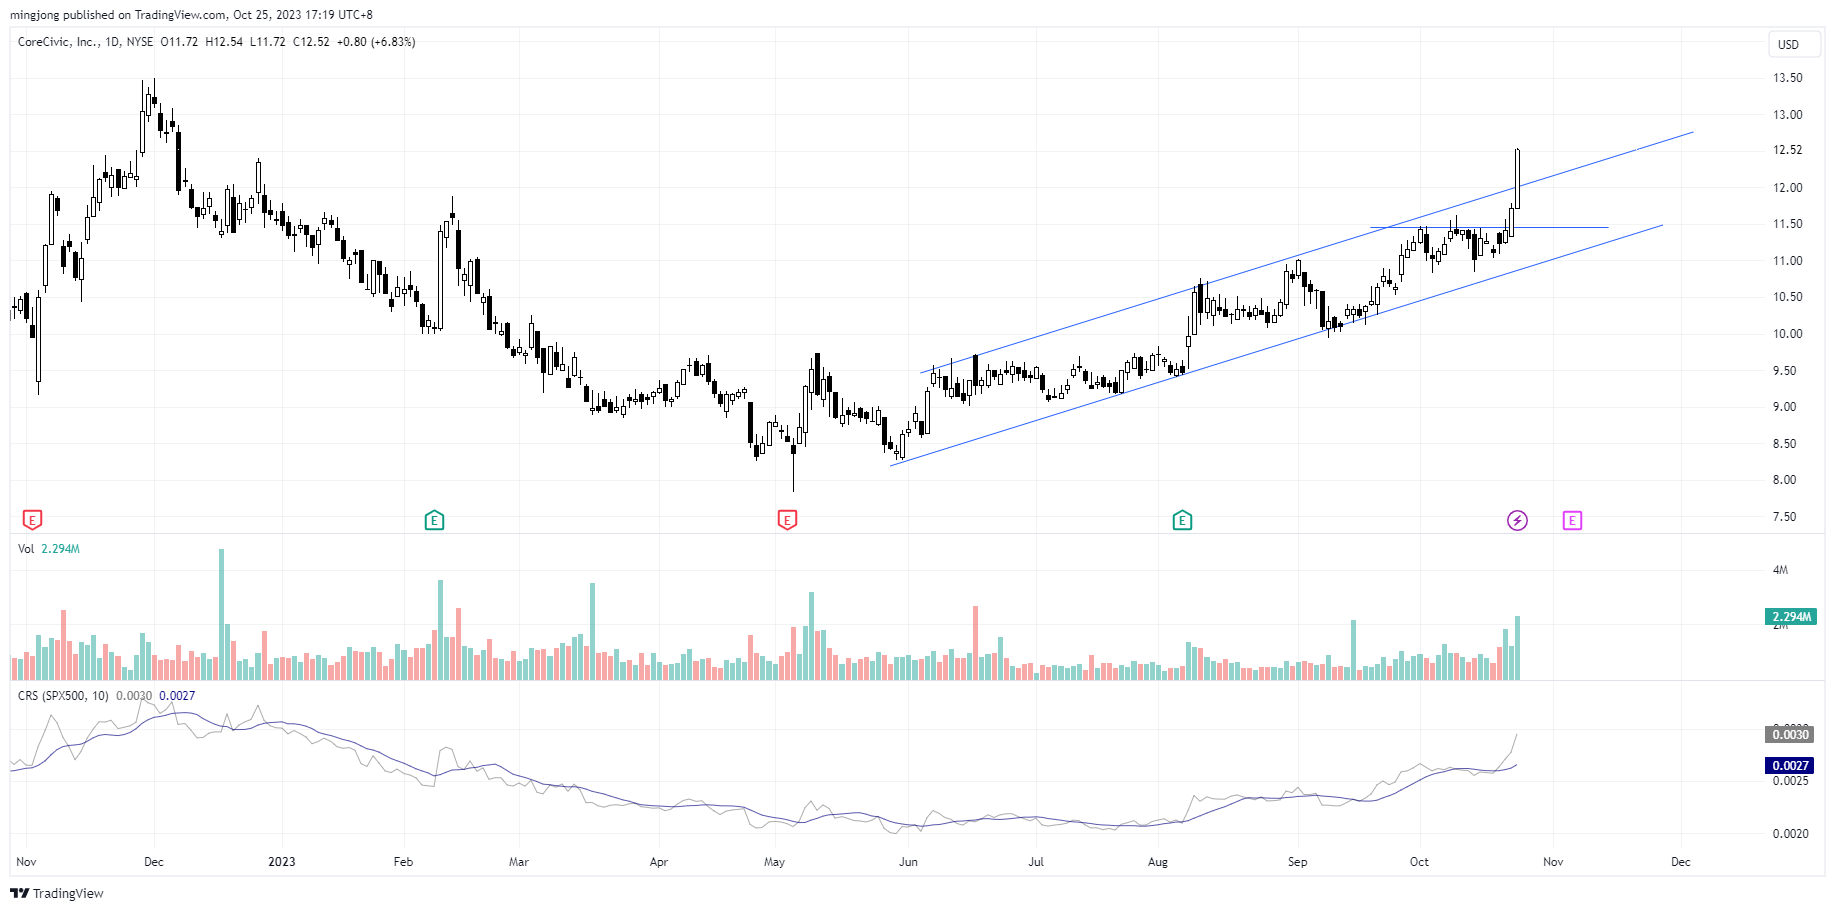
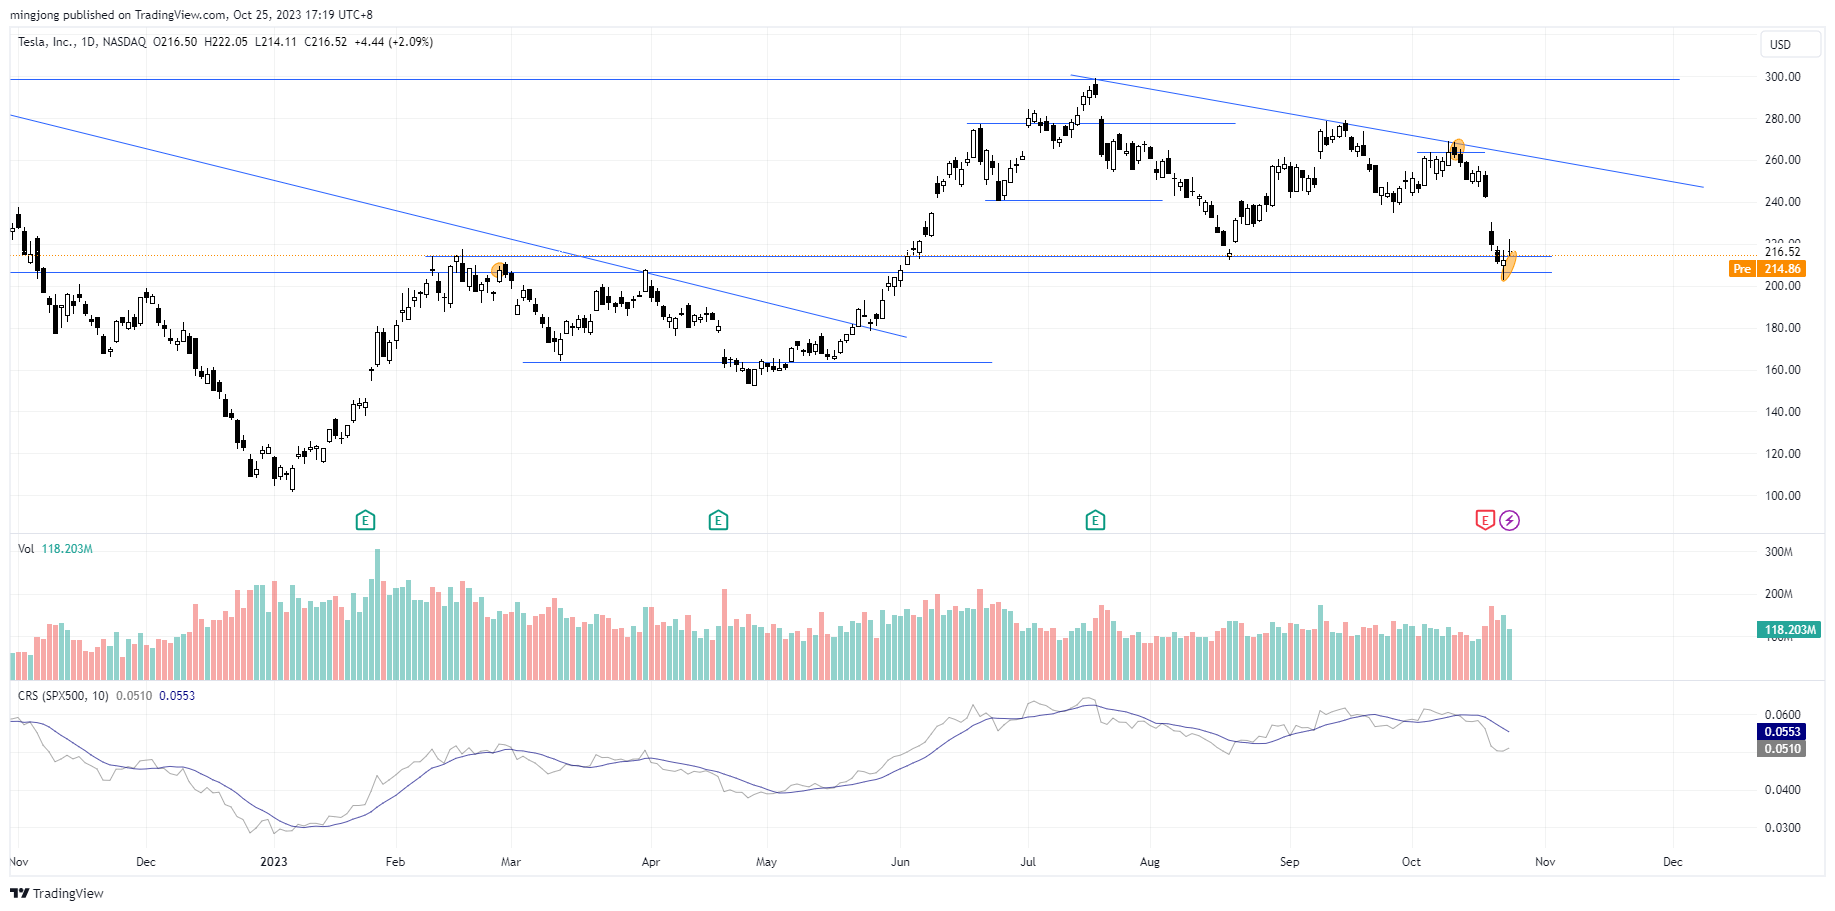
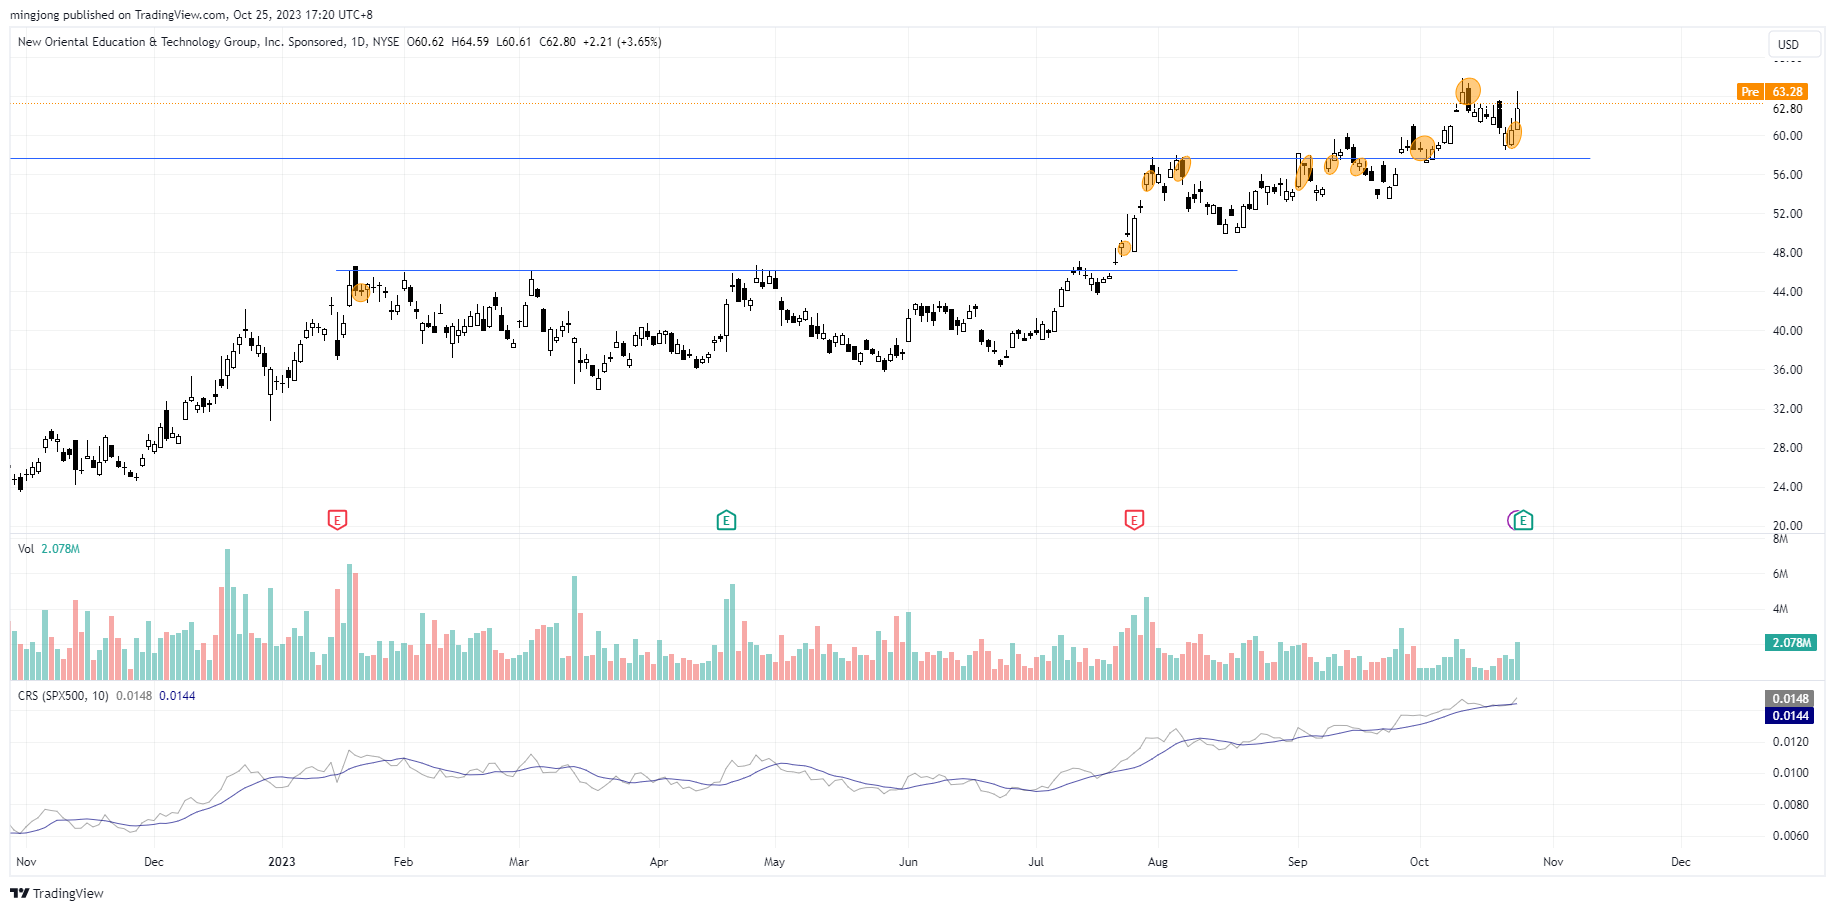
4 “low hanging fruits” (TRMD, CXW, etc…) trade entries setup + 7 others (TSLA, EDU, etc…) plus 25 “wait and hold” candidates are discussed in the video (32:43) accessed by subscribing members below.

Comments are closed.