

For those of you who don’t know, here’s a straight-to-the-point crash course on what support and resistance is.
Firstly, let’s look at an example of a well-defined level of resistance on the GBPUSD:
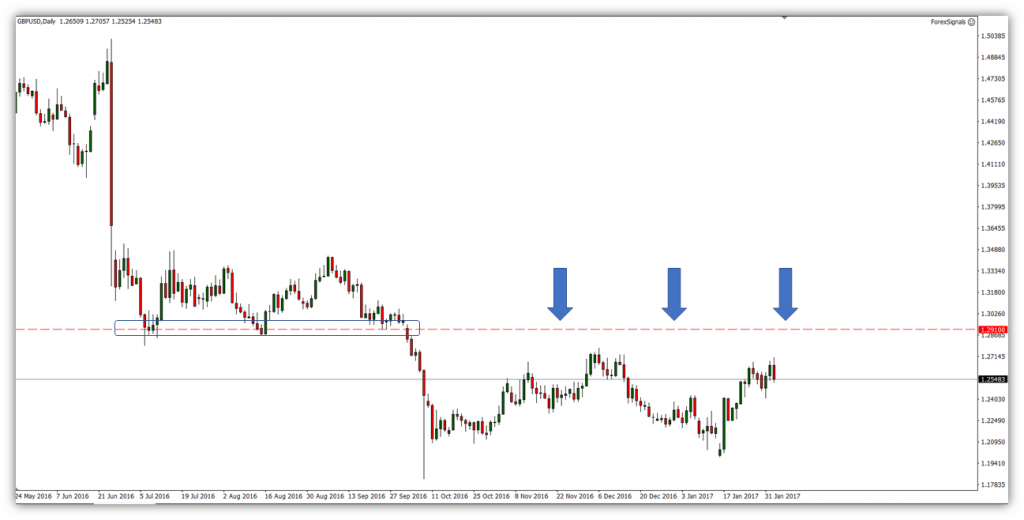
This is the most recent (relative to the time of this post) chart from the GBPUSD pair. Every ‘Tom, Dick and Harry’ around the world will be aware of this level @ 1.29 – 1.29100 (‘dog zone’).
A trader will refer to a price level as resistance if price is either revisiting a level that has been challenged before or like the example above, is now coming up to ‘check’ old support.In the example above on GBPUSD, if price rotates back up toward this level at 1.29-.1.291, then we can consider this as the 1st touch of resistance. This is because of the old support (which is highlighted in the blue box) and that price is bullish into the level. If price was bearish into a level of equal significance like this, then we’d refer to it as support (again, like what we’ve seen outlined in the blue box).
Support and resistance is an intrinsic part of any financial market. They’re defined by market participants (you and me) and is a level in which supply and demand (aka order flow) rapidly shifts. It’s the level where the bulls and bears collide and as an aggregate, the winning side prevails. It’s a price where the market is almost in a submissive or reactive point as buyers or sellers yield to their counterparties.
Why is support and resistance useful to your trading
In the example on GBPUSD above, knowing that 1.29 – 1.291 was previously significant support, we’re able to set ‘traps’ in anticipation that if GBPUSD revisits this level, we’re ready to react. Said another way; we’re wanting to be aware of key potential turning points to minimise the risk and maximise our reward as much as possible. What I’m referring to here in trading is known as “R multiples” but that’s for another article.
If we can highlight a major level of support or resistance, then we know where an optimal entry point in the market is.
As this is a discretionary process, we need to be aware of a few things when considering a level as significant or not. This is because although this is not a clear science, we can still acknowledge some fundamental logic.
How to find significant support and resistance levels
Let me lay down the broad rules from what I’ve observed over nearly 10 years in Forex:
- Price doesn’t turn on a dime.
- They’re not precise levels but instead ‘ranges’ or ‘zones’
- Higher the time frame, the more reliable
- The more a level is ‘checked’ in quick succession, the more probable it is to break
- ‘Distance makes the heart grow fonder’
- If price repels from a signifcant level for a long period in time, that level becomes more significant to pierce on the first revisit.
- Spacing from each peak / trough is important
- Focus more on the close price of each bar when evaluating a level
- Support and resistance levels are more likely to break during higher liquid times of the day.
- Whole numbers hold more interest – e.g. 1.2300 / 1.2000 (Carol Osler Ph.D. wrote an engaging publication on micro-structure of Forex).
Generally, what can make your life easier in finding these levels is to look on the “line graph” on Metatrader 4. This will show you all the close prices of each bar.
Again, this is the daily time frame on the same GBPUSD chart. You can see that I am not looking for perfect levels where price has turned on a dime but I am roughly conforming to the broad points above.
Get into the routine of drawing significant and clear levels of support and resistance. It not only serves you in being aware of ‘hurdles’ or levels in which price may struggle, but more importantly how you can be prepared to trade these levels if and when price revisits them.
Comments are closed.