

Article by IG Chief Market Analyst Chris Beauchamp
Dow Jones, Nasdaq 100, CAC40 Analysis and Charts
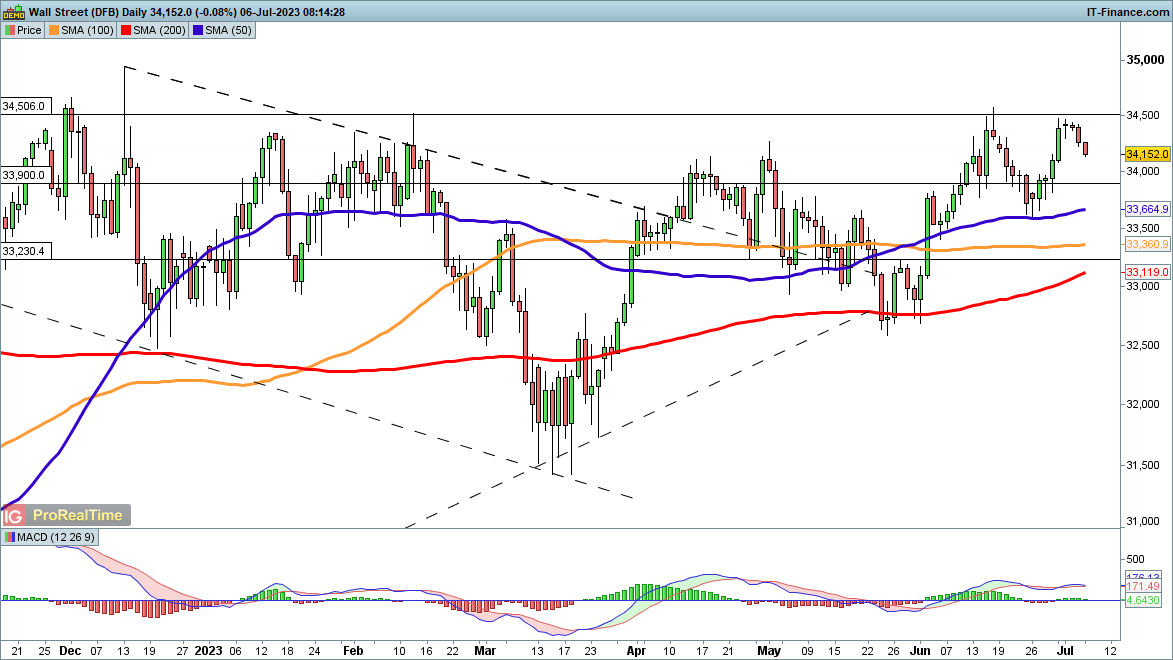
Dow falls back for another day
The index continues to drop back from last week’s highs, and further losses will put the 50-day simple moving average (SMA) into view as potential support, as it was in mid-June.Below this the 100-day SMA and then the 200-day SMA come rapidly into view. A move below the mid-May lows would firmly alter the medium-term view to a bearish one.
Bulls will want a recovery back above 34,500 in order to suggest that the move higher is back in play.
Dow Jones Daily Price Chart
Recommended by IG
Building Confidence in Trading
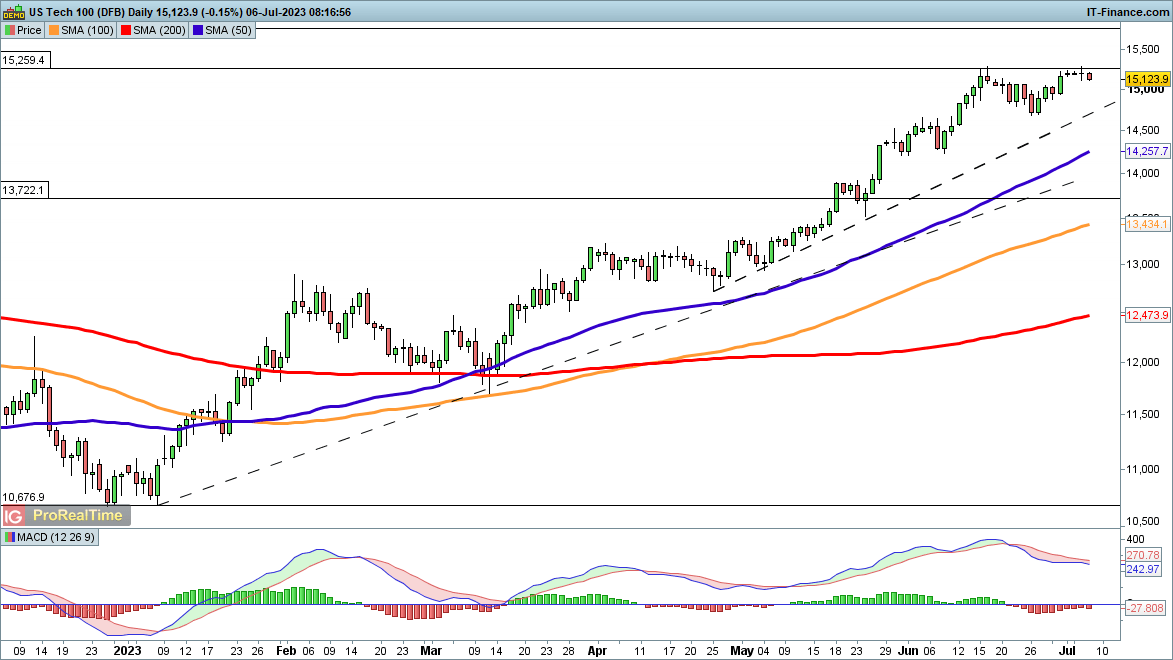
Nasdaq 100 holds near recent highs
After attempting to rally yesterday the index has fallen back again, though it remains close to its recent highs. A deeper pullback targets trendline support from late April, and then on down to the 50-day SMA. The index has not tested the 50-day SMA since early March, so a pullback to that level would not be too surprising in the near term.
Above 15,260, the price will target 15,760, and then on to 16,630.
Nasdaq 100 Daily Price Chart
Trade Smarter – Sign up for the DailyFX Newsletter
Receive timely and compelling market commentary from the DailyFX team
Subscribe to Newsletter
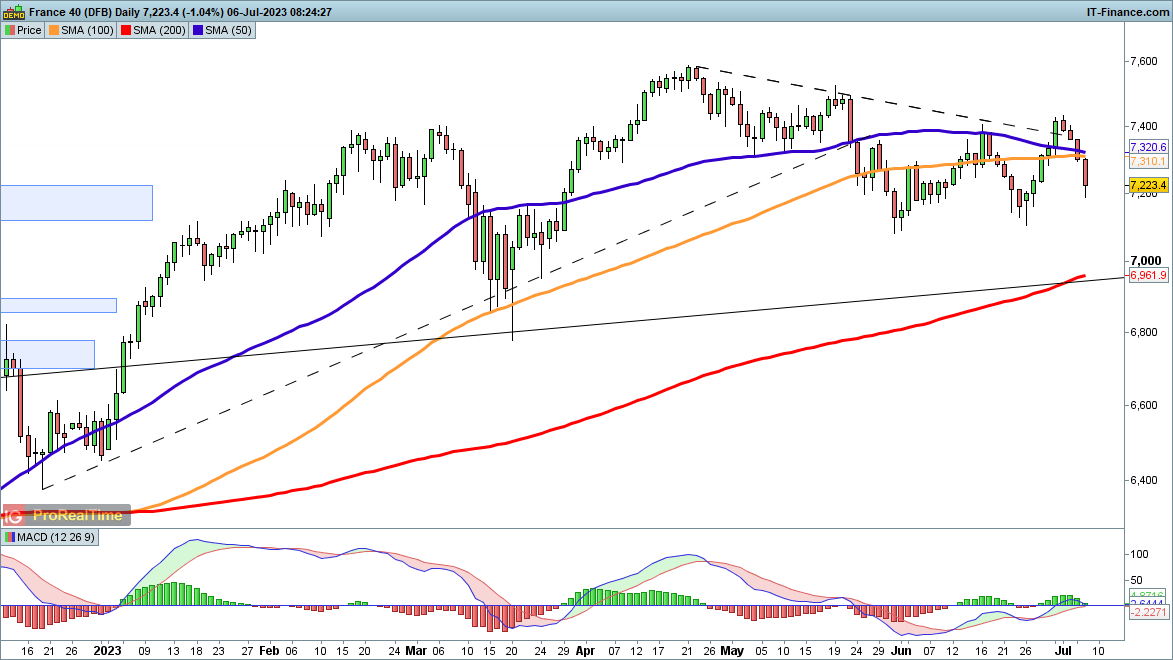
CAC40 hits a one-week low
The index has fallen back below trendline resistance from the April highs, and is also back below the 50- and 100-day SMAs. A move back to 7100, the support area from May and June, seems likely, and if this is broken the 200-day SMA comes into view.
It would need a move back above 7320 to suggest a revived bullish view, and then a break above 7400 to confirm a move higher.
CAC40 Daily Price Chart

Comments are closed.